Fig. 8.
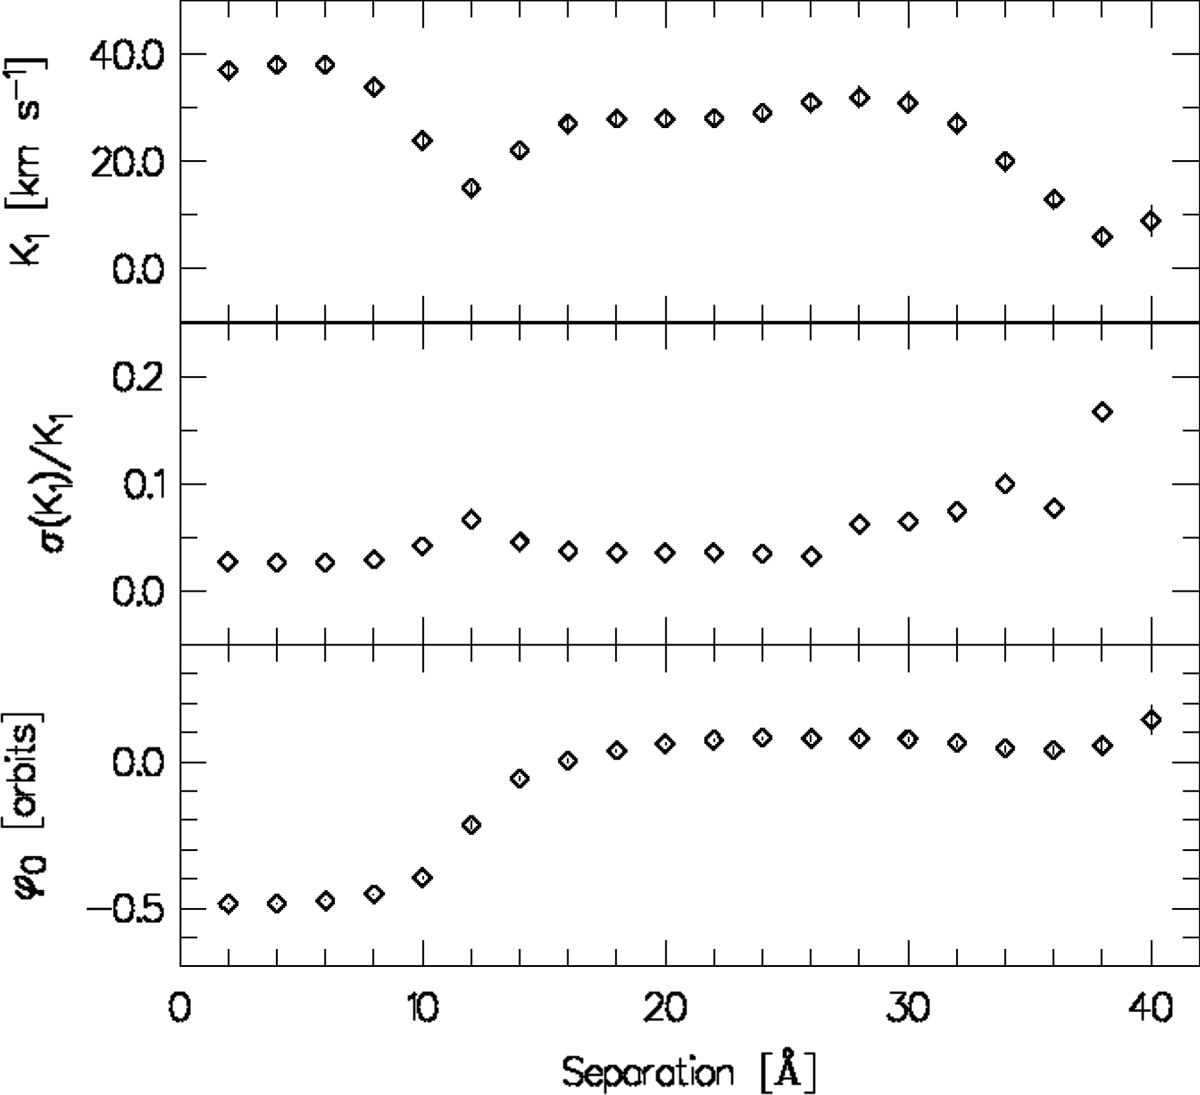
Hα diagnostic diagram: radial velocity amplitude K, its uncertainty, and the offset of the orbital phase (red to blue crossing yields ϕ0 = 0) plotted against the separation of the two Gaussians used for the fitting (see text for details). For small separations, the Gaussians trace the central peak of the emission line and the resulting parameters are close to those listed in Table 2. For separations between 16 and 26 Å, the fitting gives stable parameters while the wings are traced. Further outside, the noise increases and the parameters start varying accordingly.
Current usage metrics show cumulative count of Article Views (full-text article views including HTML views, PDF and ePub downloads, according to the available data) and Abstracts Views on Vision4Press platform.
Data correspond to usage on the plateform after 2015. The current usage metrics is available 48-96 hours after online publication and is updated daily on week days.
Initial download of the metrics may take a while.