Free Access
Fig. 7.
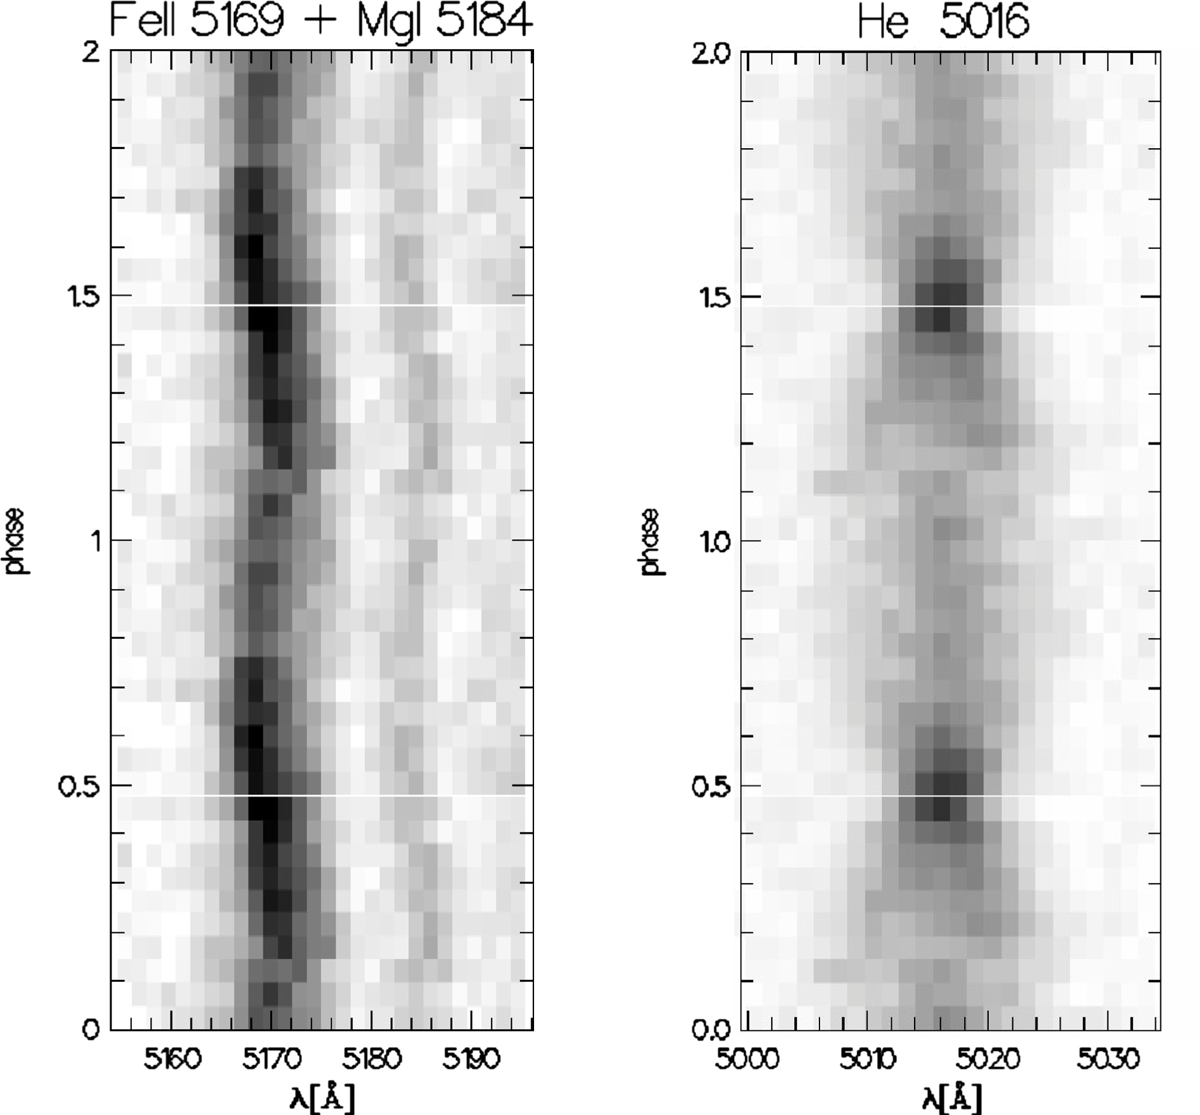
Trailed spectrograms of the FORS1 data showing the different behaviour of the Fe II and He I lines. The weak emission on the red side of the 5169 Å emission is MgI 5184 Å
Current usage metrics show cumulative count of Article Views (full-text article views including HTML views, PDF and ePub downloads, according to the available data) and Abstracts Views on Vision4Press platform.
Data correspond to usage on the plateform after 2015. The current usage metrics is available 48-96 hours after online publication and is updated daily on week days.
Initial download of the metrics may take a while.