Fig. 5.
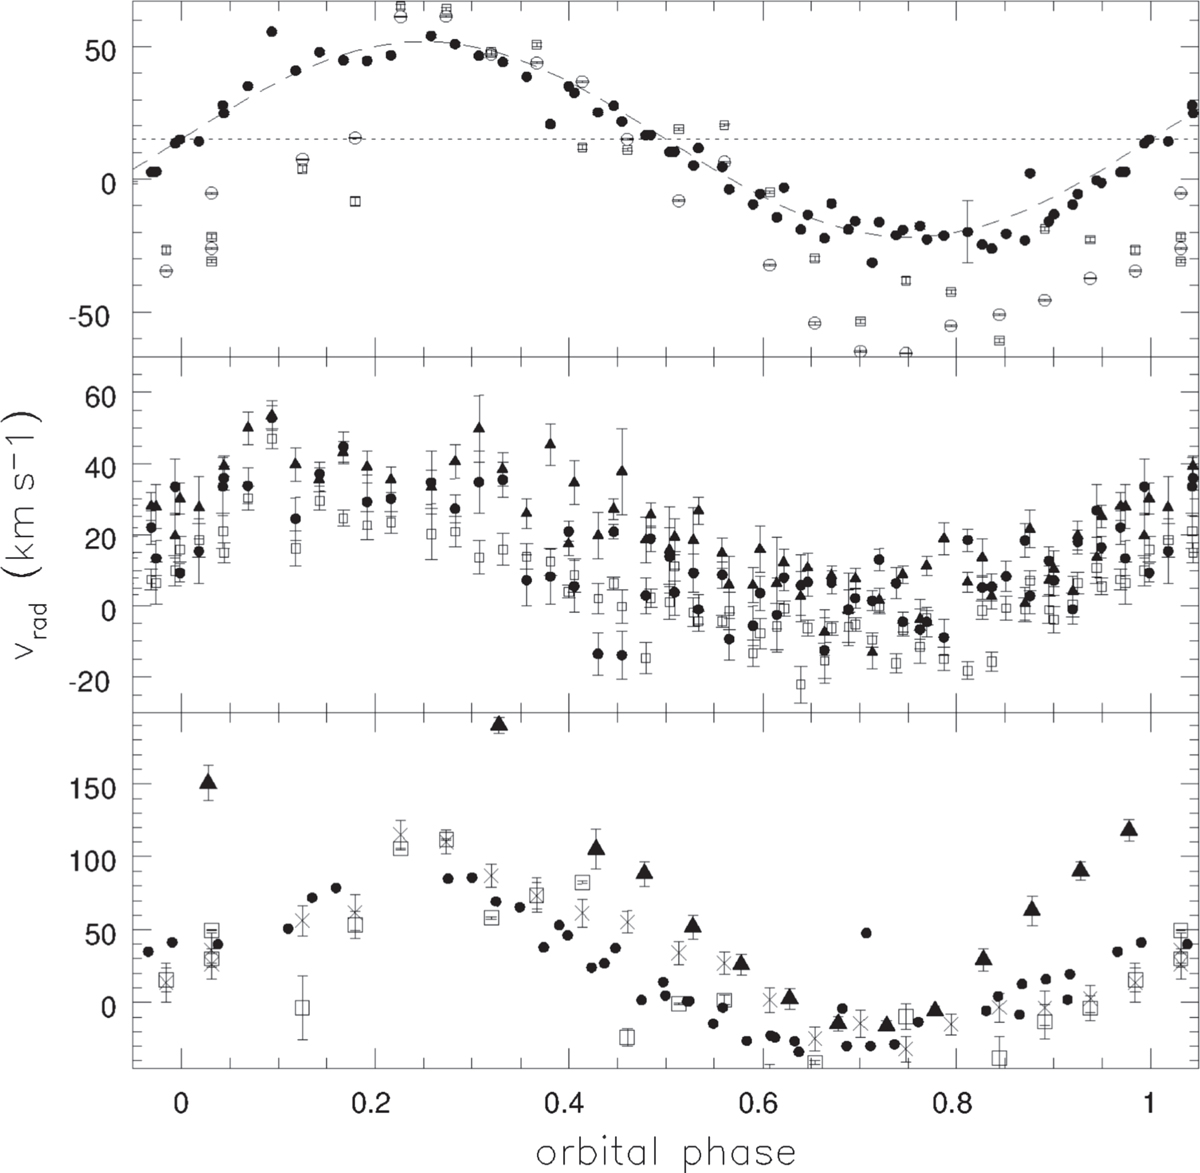
Radial velocity curve of the observed emission lines and the TiO absorption. Top panel: Balmer lines: FORS2 Hα measurements are marked by black filled circles, FORS1 Hα measurements by empty circles, and FORS1 Hβ measurements by empty squares. Middle panel: radial velocity of the three HeI emission lines as measured in the FORS2 spectra. Bottom panel: radial velocity measurements of TiO bandhead (black triangles), NaI D emission (black circles), FeII 5169 blending with MgI (crosses), and MgI 5183 (empty squares).
Current usage metrics show cumulative count of Article Views (full-text article views including HTML views, PDF and ePub downloads, according to the available data) and Abstracts Views on Vision4Press platform.
Data correspond to usage on the plateform after 2015. The current usage metrics is available 48-96 hours after online publication and is updated daily on week days.
Initial download of the metrics may take a while.