Fig. 2.
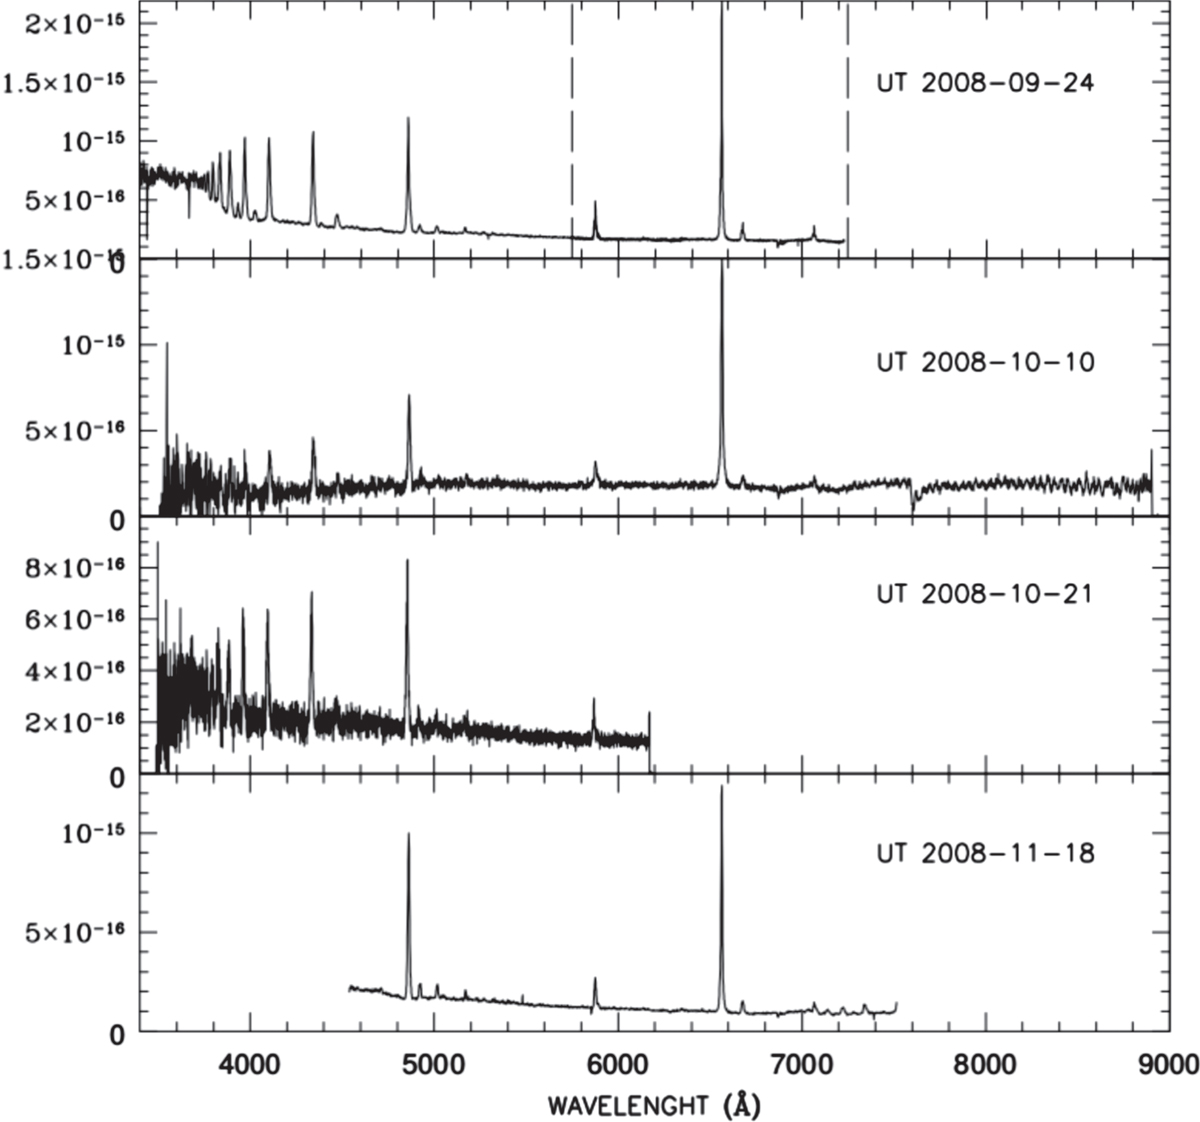
Sample fluxed spectra (ergs/cm2 s−1/Å) from the spectroscopic observations in Table 1. The UT date of each observing run is indicated in the figure itself. The dashed vertical lines in the top panel delimit the wavelength range of the time series from 27 October. The emission lines in the November 2008 spectrum (bottom panel) redward of 7000 Å are due to second-order overlap (see text).
Current usage metrics show cumulative count of Article Views (full-text article views including HTML views, PDF and ePub downloads, according to the available data) and Abstracts Views on Vision4Press platform.
Data correspond to usage on the plateform after 2015. The current usage metrics is available 48-96 hours after online publication and is updated daily on week days.
Initial download of the metrics may take a while.