Fig. 1.
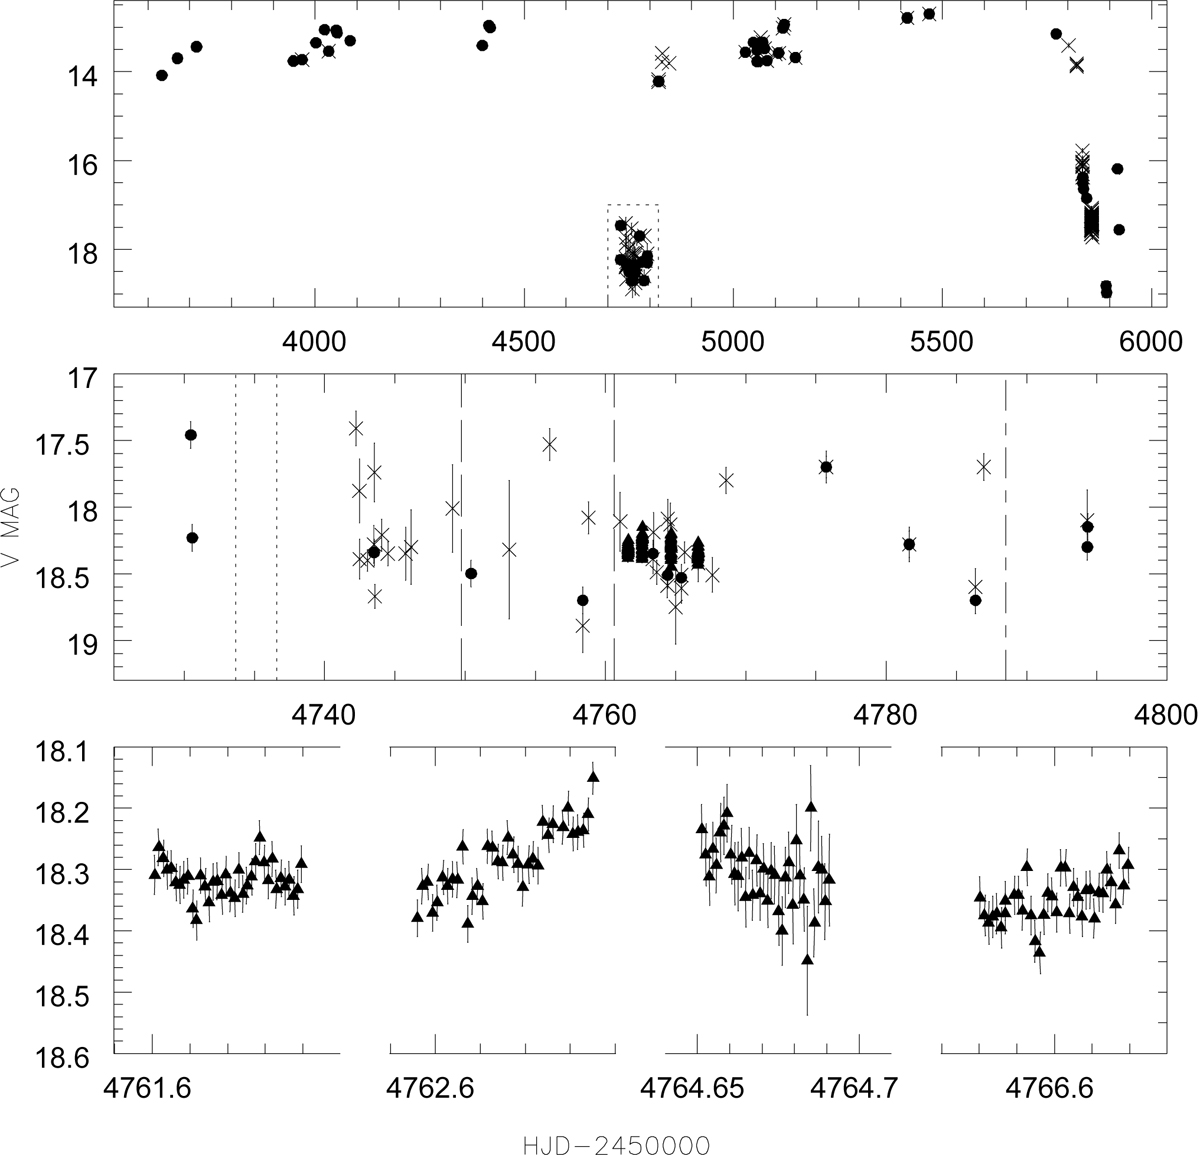
Top: long-term V-band light curve of VY Scl showing 4.17 years of photometric coverage (01 September 2006 to 31 October 2010). The “x” symbols are observations from the AAVSO data base, while black circles are from the M1 Group (Spanish amateur astronomers). Middle: enlarged view of the data points in the dotted box marked in the top panel. The “x” symbols and black circles are as above. Black triangles refer to the SMARTS V band photometry (see Table 1). The vertical dotted lines mark the start of the two FORS2 runs, the dashed lines mark the start of the two Goodman runs, and the long dash-short dashed line mark the start of the FORS1 run. Bottom: zoomed in view of the SMARTS photometry.
Current usage metrics show cumulative count of Article Views (full-text article views including HTML views, PDF and ePub downloads, according to the available data) and Abstracts Views on Vision4Press platform.
Data correspond to usage on the plateform after 2015. The current usage metrics is available 48-96 hours after online publication and is updated daily on week days.
Initial download of the metrics may take a while.