Fig. 8.
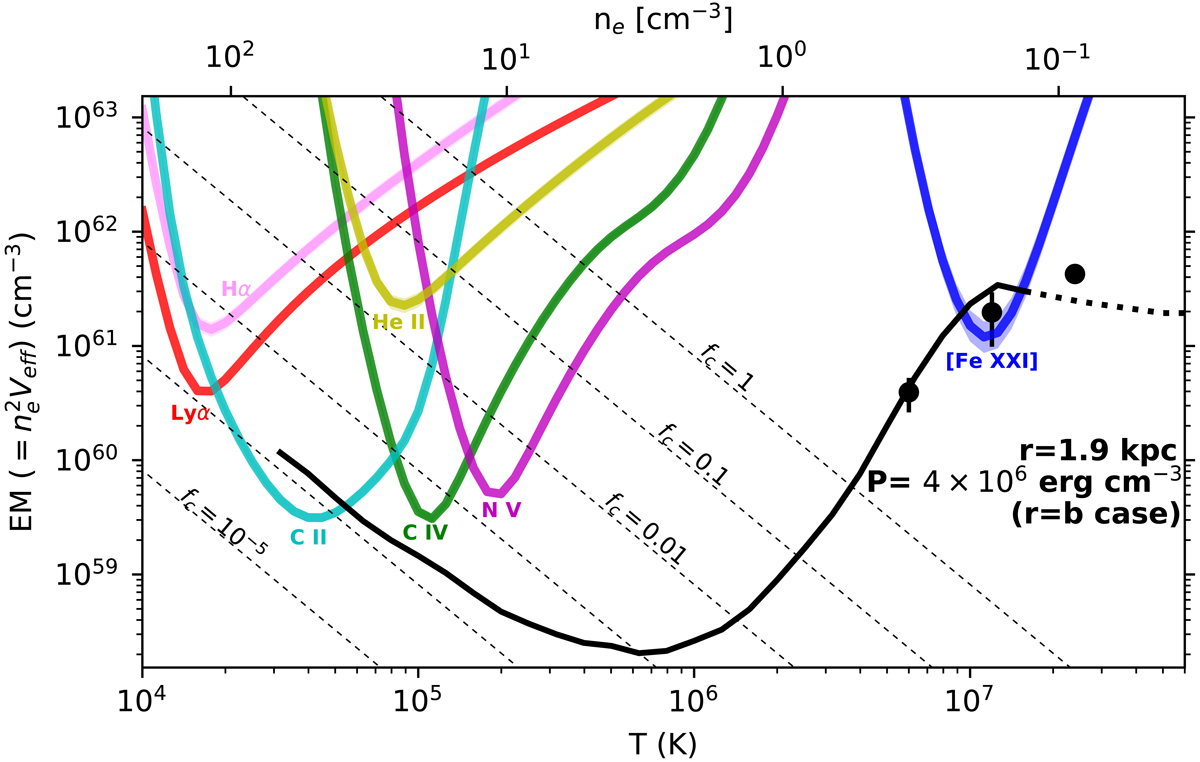
Emission measure curves for Hα and each of the FUV lines we measure, assuming the line is produced under CIE and using Eq. (1). In general it can be expected that the EM of a species is close to the minimum value along its curve, and the 1σ uncertainties on line flux are propagated into this plot as the shaded regions around each curve (which are usually smaller than the width of the curve used in the plot). For comparison, we also plot with black points the emission measure of various phases of the hot ICM, as measured by Werner et al. (2013), and we note that the EM of T ~ 1 × 10⁷ K plasma implied by our measurement of [Fe XXI] matches the X-ray measurement. Next, we specify a pressure of 4 × 106 cm−3 K (Churazov et al. 2008) which assumes no projection effects, so that distance r from the nucleus of M87 is equal to the observed impact parameter b. Our physical model is a cylindrical filament with a radius rc = 10 pc (see Sect. 8.1) filled with clumps that occupy a volume filling factor fc of the filament volume (see Eq. (2)). Assuming the FUV lines are emitted from the filament, we plot lines of constant fc. The FUV-emitting plasma must have a volume filling factor 10−5 ≲ fc ≲ 10−2, with the exception of He II which we discuss in Sect. 6.3.2. Finally, we overlay a normalized model of the EM for a solar flare (Dere & Cook 1979), which offers a rough match to the observed FUV lines, with the exception of He II and Hα, which have contributions from photoionization as we discuss in the text.
Current usage metrics show cumulative count of Article Views (full-text article views including HTML views, PDF and ePub downloads, according to the available data) and Abstracts Views on Vision4Press platform.
Data correspond to usage on the plateform after 2015. The current usage metrics is available 48-96 hours after online publication and is updated daily on week days.
Initial download of the metrics may take a while.