Fig. B.1.
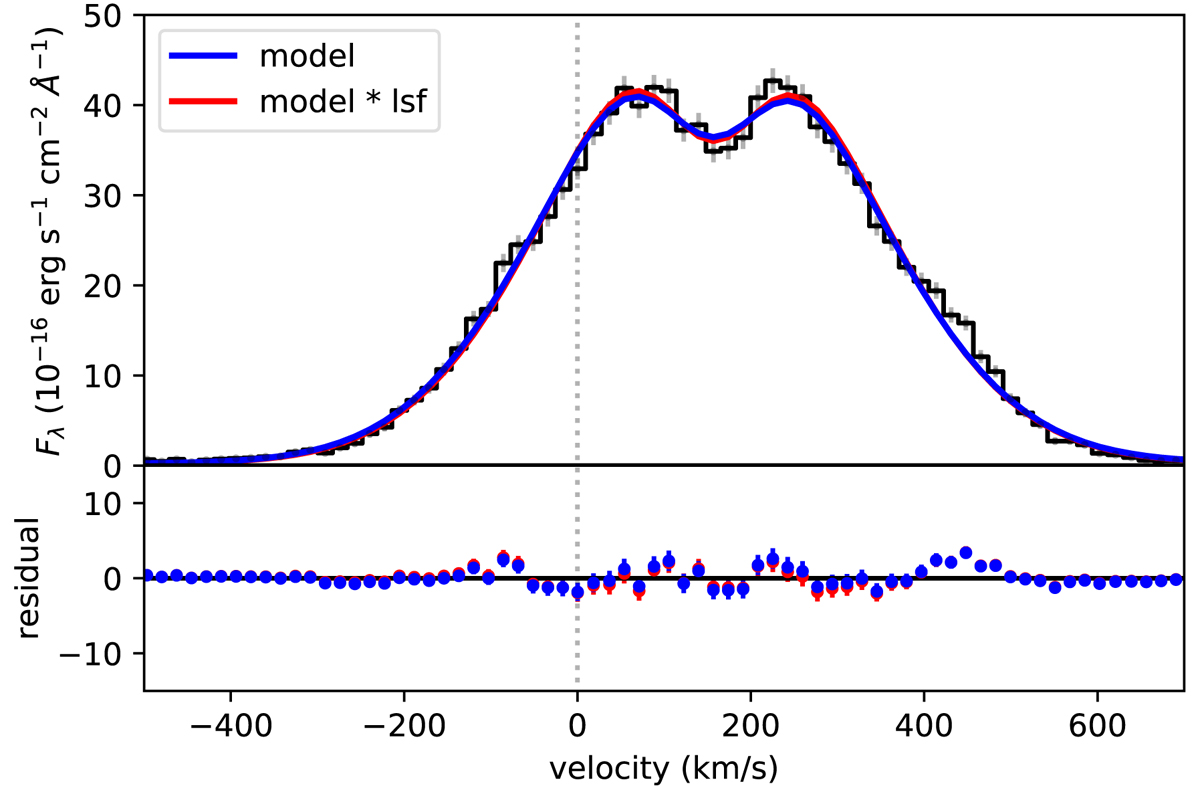
Portion of the spectrum around Lyα, along with our best-fit model from Sect. 3.4 (blue) and this best-fit model convolved with the COS line spread function (red). The lower panel shows the residuals between both models and the data. The two models are nearly identical, and the convolution of the line spread function with the model increased the χ2 by only 0.8 when including a systematic error term as described in Sect. 3.4. We therefore conclude that the line spread function is not a significant source of error in our model fitting, and can safely be neglected in our analysis.
Current usage metrics show cumulative count of Article Views (full-text article views including HTML views, PDF and ePub downloads, according to the available data) and Abstracts Views on Vision4Press platform.
Data correspond to usage on the plateform after 2015. The current usage metrics is available 48-96 hours after online publication and is updated daily on week days.
Initial download of the metrics may take a while.