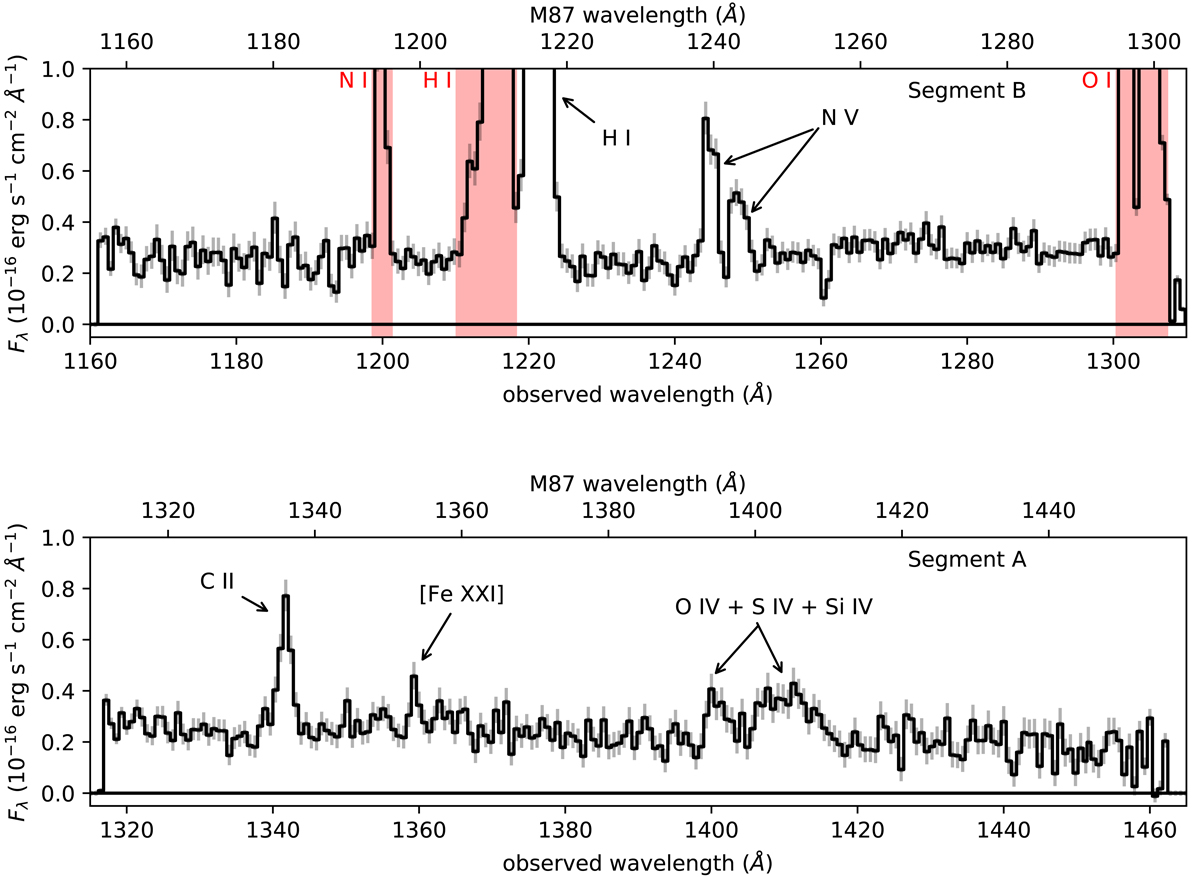
Fig. 2.

Our COS G130M spectrum of the M87 filament, divided into segments B (top) and A (bottom) for visual clarity. We have binned the spectrum in this plot into 0.70 Å bins, and display 1σ errors on each bin as described in the text (Sect. 2). Prominent emission lines are identified and discussed in Sects. 3 and 4, and airglow lines are indicated with the shaded red regions and identified with red text.
Current usage metrics show cumulative count of Article Views (full-text article views including HTML views, PDF and ePub downloads, according to the available data) and Abstracts Views on Vision4Press platform.
Data correspond to usage on the plateform after 2015. The current usage metrics is available 48-96 hours after online publication and is updated daily on week days.
Initial download of the metrics may take a while.


