Fig. 17.
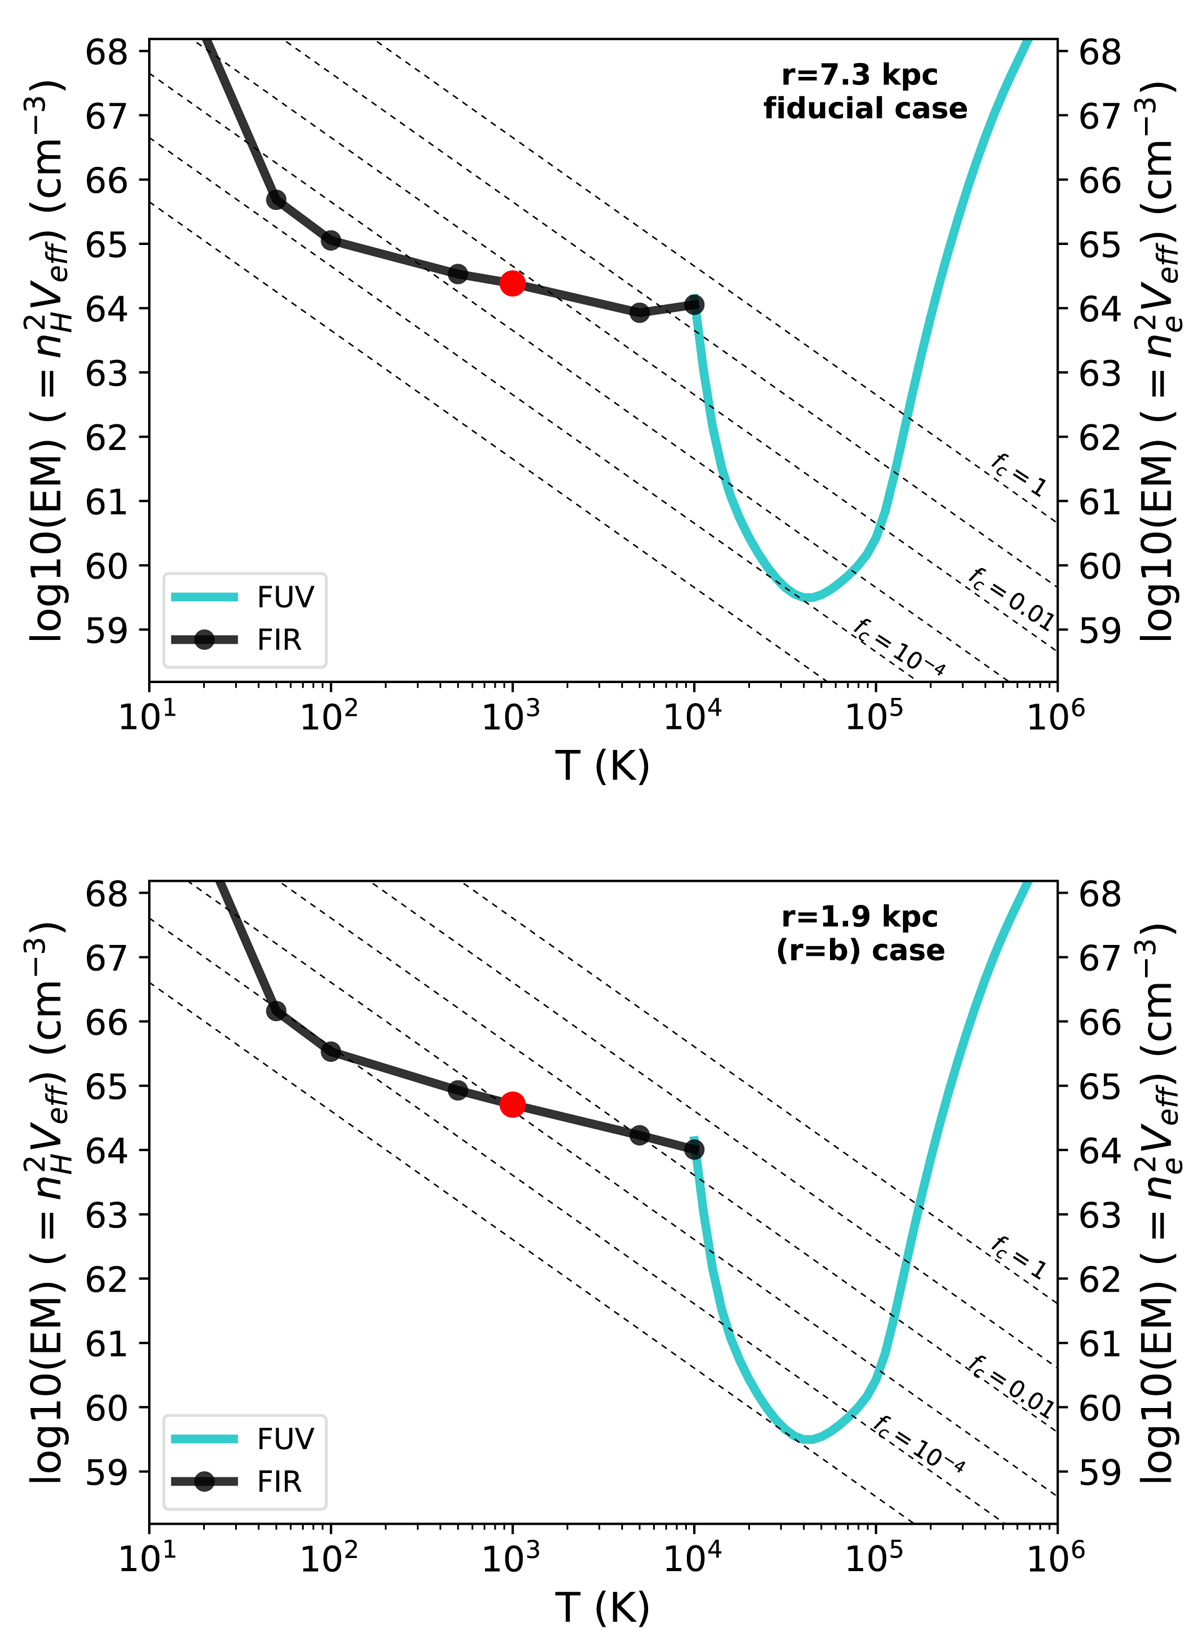
Estimated emission measures of gas emitting in the [C II] λ158 μm (FIR) line and in the C IIλ1335 (FUV) triplet in our sightline. The latter curve is identical to the curve for C II in Figs. 8 and 13, and the FIR curve is derived as described in Sect. 8.4, assuming nearly all the C in the filament is in the C+ state, and that collisions with atomic Hydrogen excite the [C II] λ158 μm transition. The red point shows our fiducial choice of temperature for the cold clumps, T = 1000 K, although we expect any value from 100 ≲ T ≲ 5000 K is possible. We have also drawn lines of constant filament volume filling factor fc, as in Fig. 8 and 13, using Eq. (5). We note that the FIR-emitting gas must have a higher fc than the FUV-emitting gas assuming the latter is at its peak emissivity at T ≈ 4 × 10⁴ K. This result holds for both choices of pressure, indicated by the upper and lower panels. This supports our model of cold FIR-emitting clumps in the filament surrounded by thin conductive boundary layers which emit the FUV lines.
Current usage metrics show cumulative count of Article Views (full-text article views including HTML views, PDF and ePub downloads, according to the available data) and Abstracts Views on Vision4Press platform.
Data correspond to usage on the plateform after 2015. The current usage metrics is available 48-96 hours after online publication and is updated daily on week days.
Initial download of the metrics may take a while.