Fig. 15.
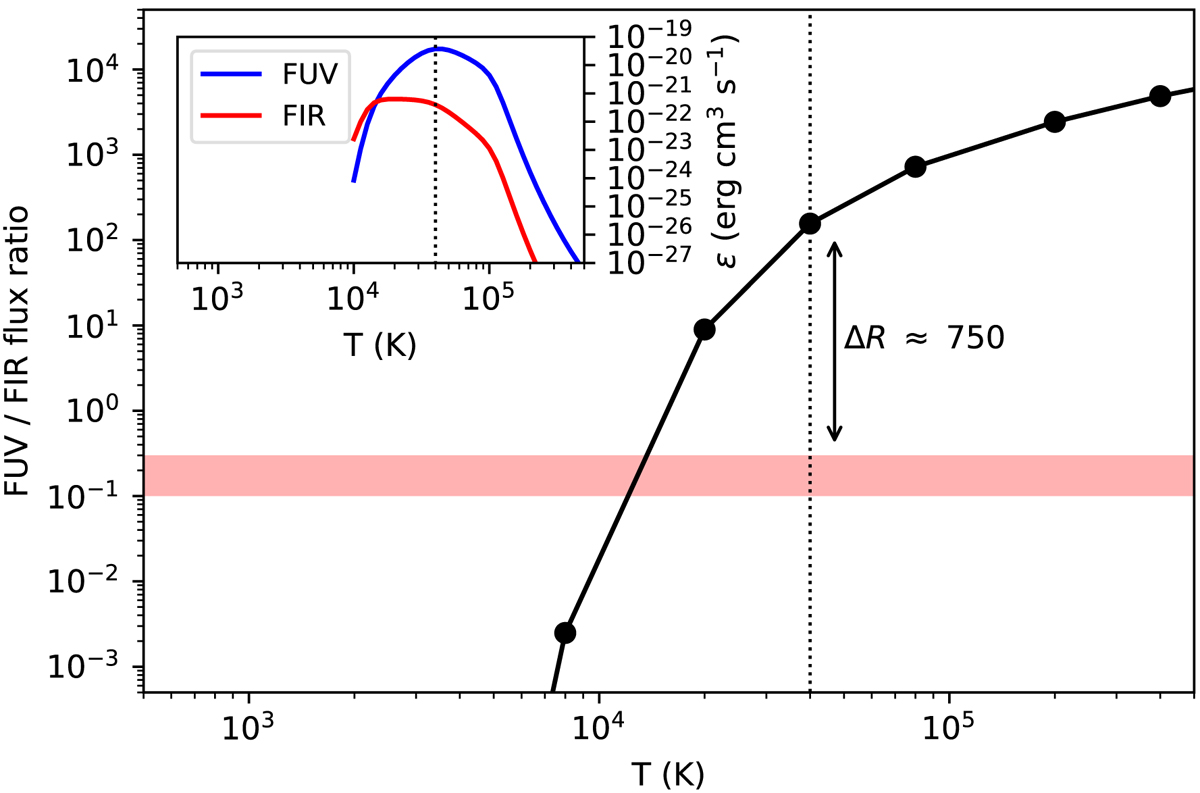
The main plot shows the expected flux ratio between the C II λ1335 triplet and the [C II] λ158 μm forbidden line as a function of temperature, in the low-density limit (n ≲ 10–100 cm−3). The inset shows the emissivities of the FUV triplet and the FIR line as a function of temperature, again in the low-density limit. The FUV emissivity is strongly peaked around T ~ 4 × 10⁴ K (indicated with the dotted black line in both plots), and at this temperature the expected flux ratio is about 150. The observed ratio, denoted with the red shaded region, is about 0.2, so the discrepancy between the CIE expectation and the observation is a factor of 750. We therefore invoke a two-phase model: the C II λ1335 emission can be associated with a T ~ 4 × 10⁴ K phase of the thin “skin” surrounding the filament core, while the [C II] λ158 μm emission can be associated with clumps at T ~ 103 K which comprise the core of the filament, which we discuss in Sect. 8.
Current usage metrics show cumulative count of Article Views (full-text article views including HTML views, PDF and ePub downloads, according to the available data) and Abstracts Views on Vision4Press platform.
Data correspond to usage on the plateform after 2015. The current usage metrics is available 48-96 hours after online publication and is updated daily on week days.
Initial download of the metrics may take a while.