Fig. 13.
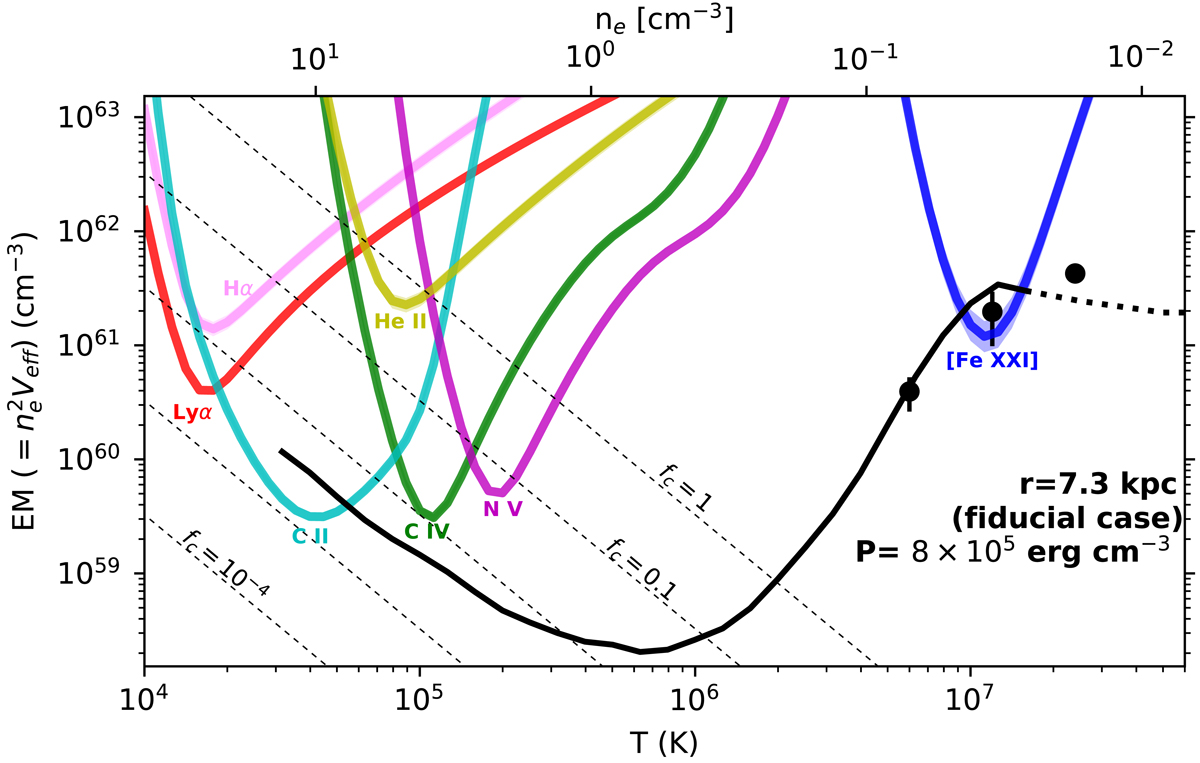
Emission measure curves for Hα and each of the FUV lines we measure, assuming the line is produced under CIE and the plasma has solar abundances. In this plot, however, we assume a pressure several times lower than the pressure used for that Fig. 8. The motivation for this change is the geometry discussed in Sect. 7.1, where the filament is behind the E radio lobe and the counter-jet, so its true distance from the nucleus of M87 is r = 7.3 kpc while the impact parameter is still b = 1.9 kpc. We argue geometry likely applies to all the lines in this plot except for [Fe XXI], so we refer to this as the fiducial case for most of the subsequent discussion. Compared to the r = b case, the corresponding densities are therefore reduced by a factor of 4.5, and the corresponding filament volume filling factors fc are increased by a factor of 20 (see Sects. 6.5 and 7.2). Thus the FUV-emitting plasma must have a volume filling factor 10−3 ≲ fc ≲ 10−1.
Current usage metrics show cumulative count of Article Views (full-text article views including HTML views, PDF and ePub downloads, according to the available data) and Abstracts Views on Vision4Press platform.
Data correspond to usage on the plateform after 2015. The current usage metrics is available 48-96 hours after online publication and is updated daily on week days.
Initial download of the metrics may take a while.