Fig. 10.
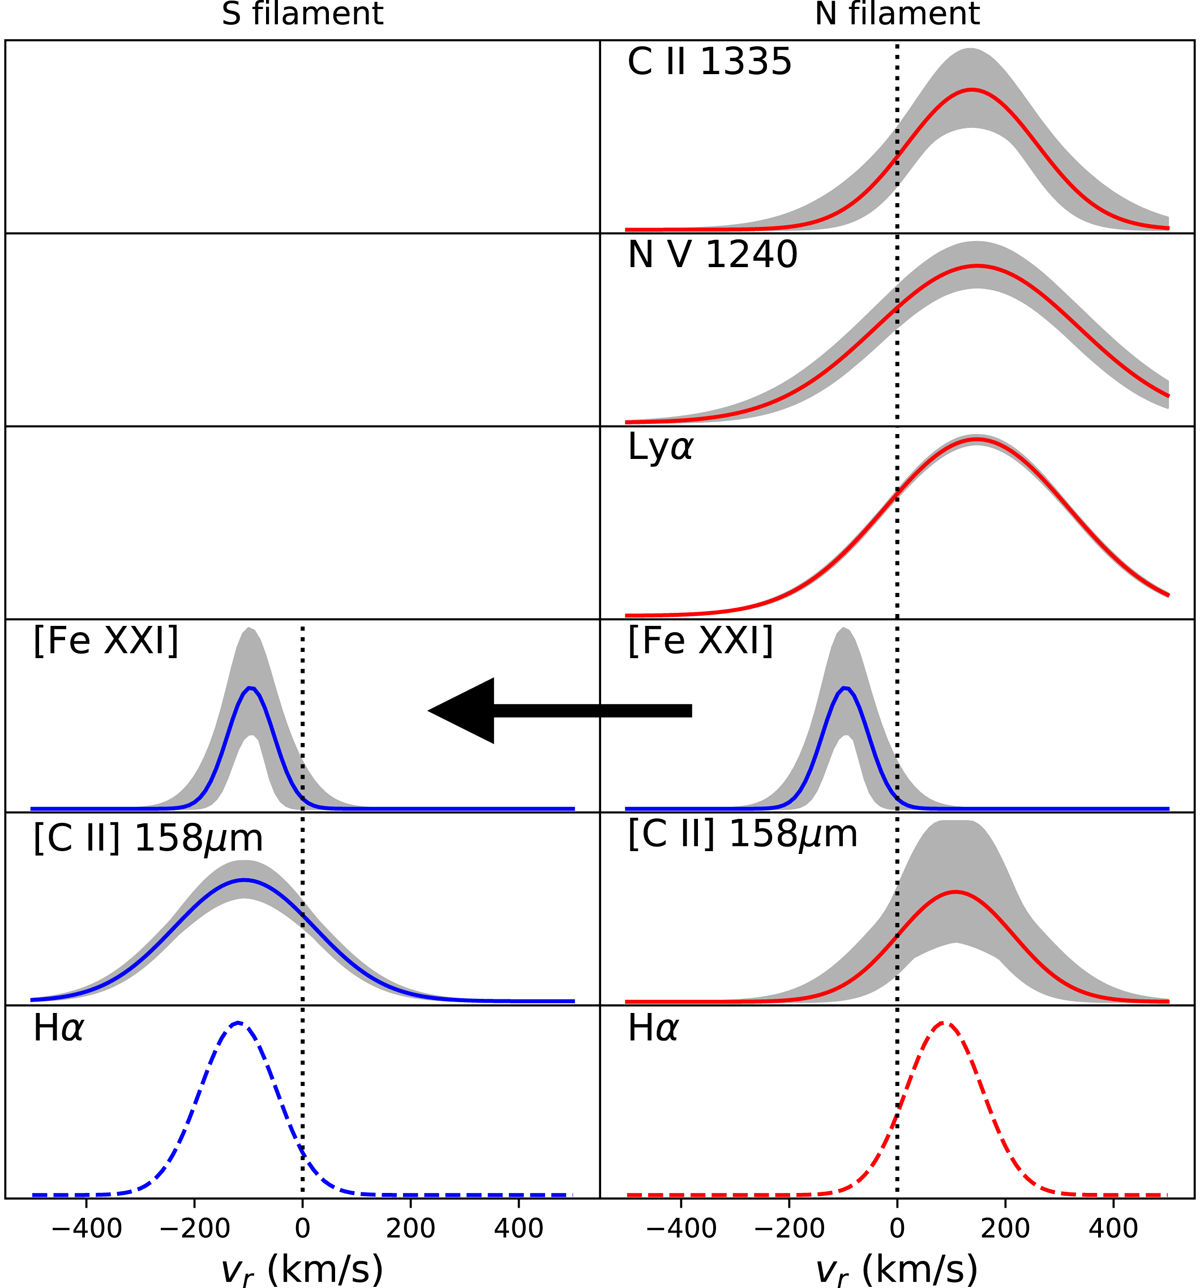
Model Gaussian profiles used in fitting each component for emission lines or multiplets toward the N and S filaments in M87, with velocity vr relative to M87. Lines fit in this paper are shown with solid lines (red for redshifted lines and blue for blueshifted lines), and data for Hα come from Ford & Butcher (1979). The shaded region denotes 1σ uncertainty in the model profile. All of the lines in the N filament have approximately the same profiles, except for [Fe XXI], which approximately matches the line profiles observed for the nearby S filament. We hypothesize that the two filaments trace opposite sides of the radio lobe, and in our sightline the approaching side of the filament has not cooled much below 107 K while the receding side has cooled down to 103 K or below. We note that [Fe XXI] is only observed in the N filament, but we show it in both columns to allow for easier comparison with the other lines.
Current usage metrics show cumulative count of Article Views (full-text article views including HTML views, PDF and ePub downloads, according to the available data) and Abstracts Views on Vision4Press platform.
Data correspond to usage on the plateform after 2015. The current usage metrics is available 48-96 hours after online publication and is updated daily on week days.
Initial download of the metrics may take a while.