Fig. 5.
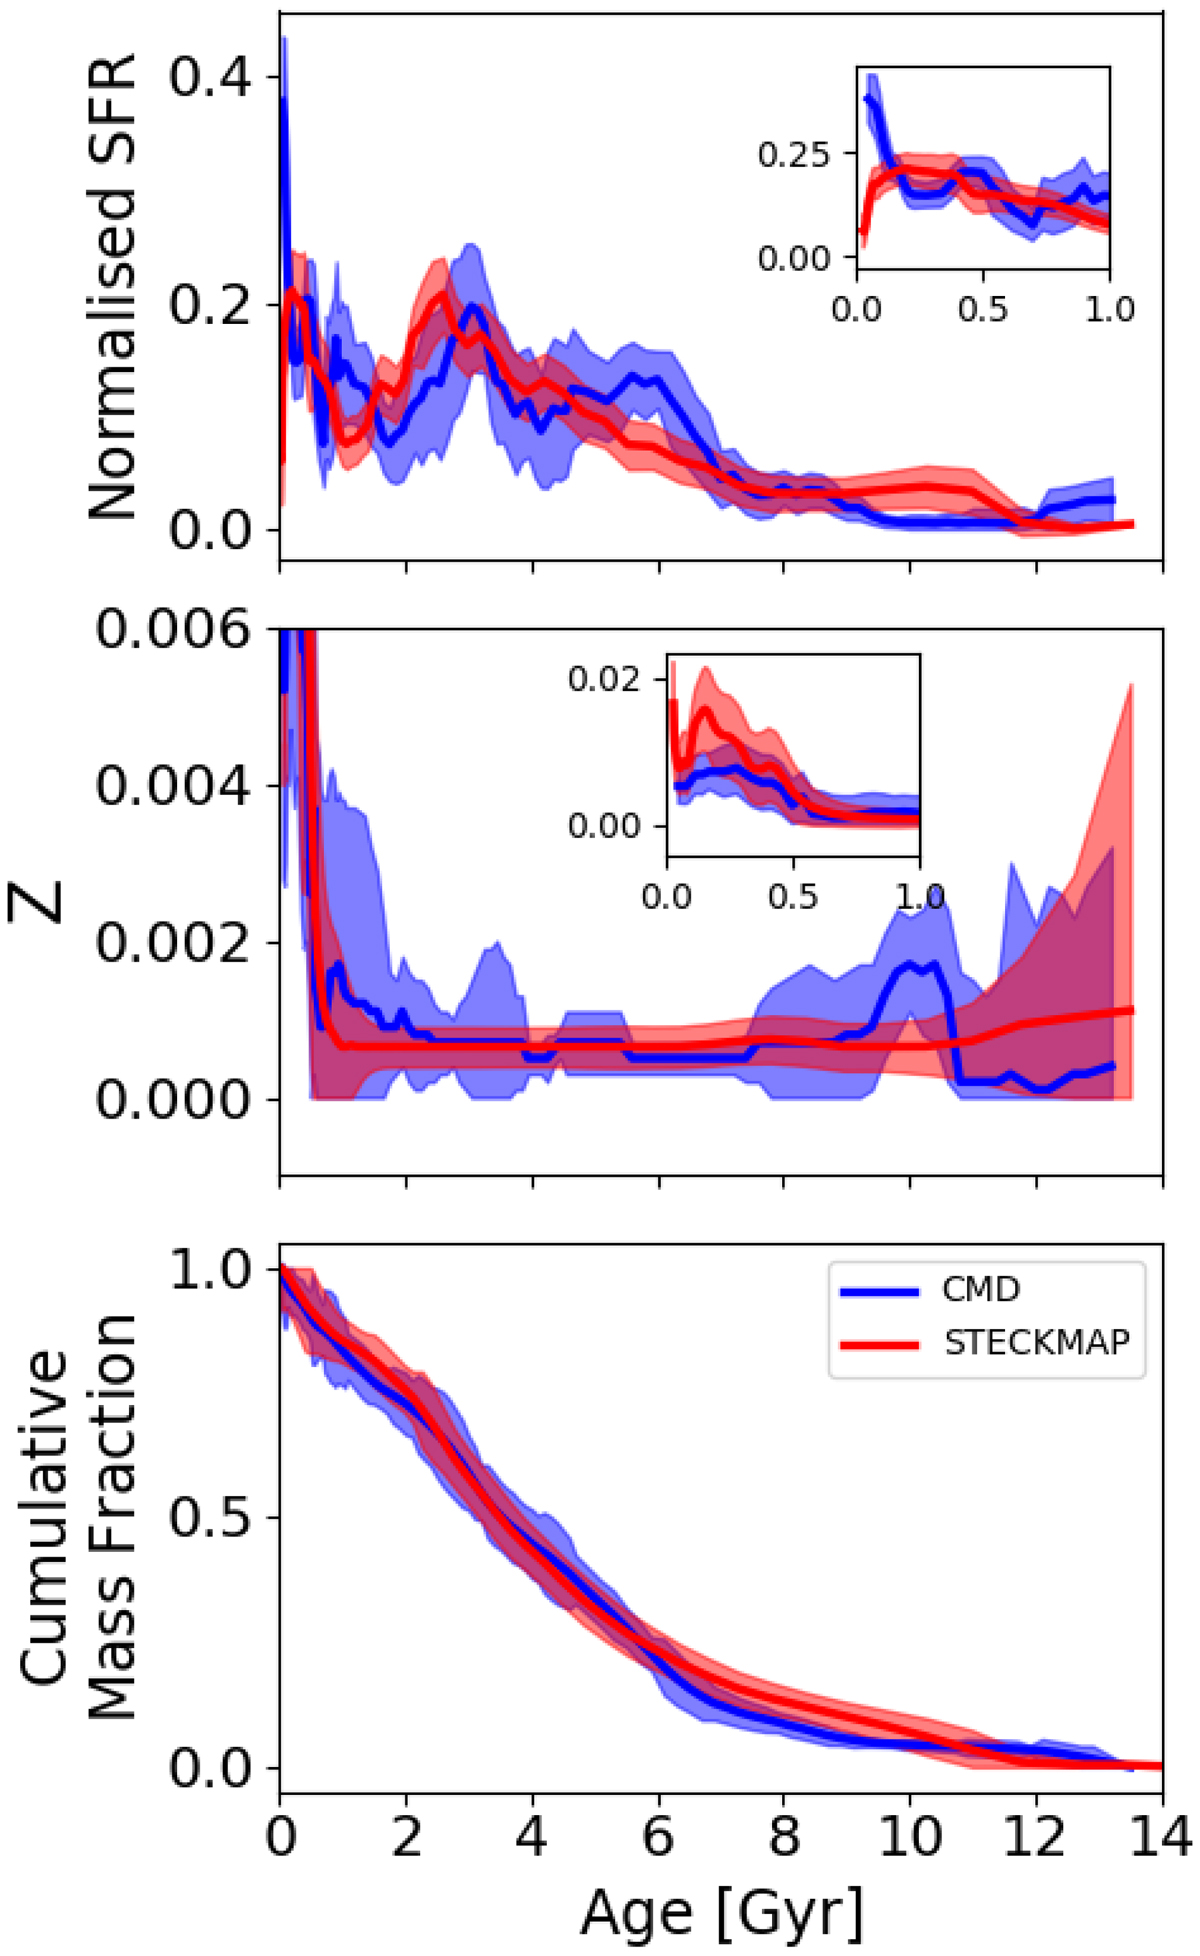
Comparison between the Leo A SFH from the CMD (blue) and the integrated spectrum using STECKMAP (red). Top panel: normalised SFR; the area under each curve is 1. Middle panel: age– metallicity relation. Bottom panel: cumulative mass fraction. See text for details on the computation of the uncertainties. Inset panels focus on the SFR and AMR at young ages.
Current usage metrics show cumulative count of Article Views (full-text article views including HTML views, PDF and ePub downloads, according to the available data) and Abstracts Views on Vision4Press platform.
Data correspond to usage on the plateform after 2015. The current usage metrics is available 48-96 hours after online publication and is updated daily on week days.
Initial download of the metrics may take a while.