Fig. 2.
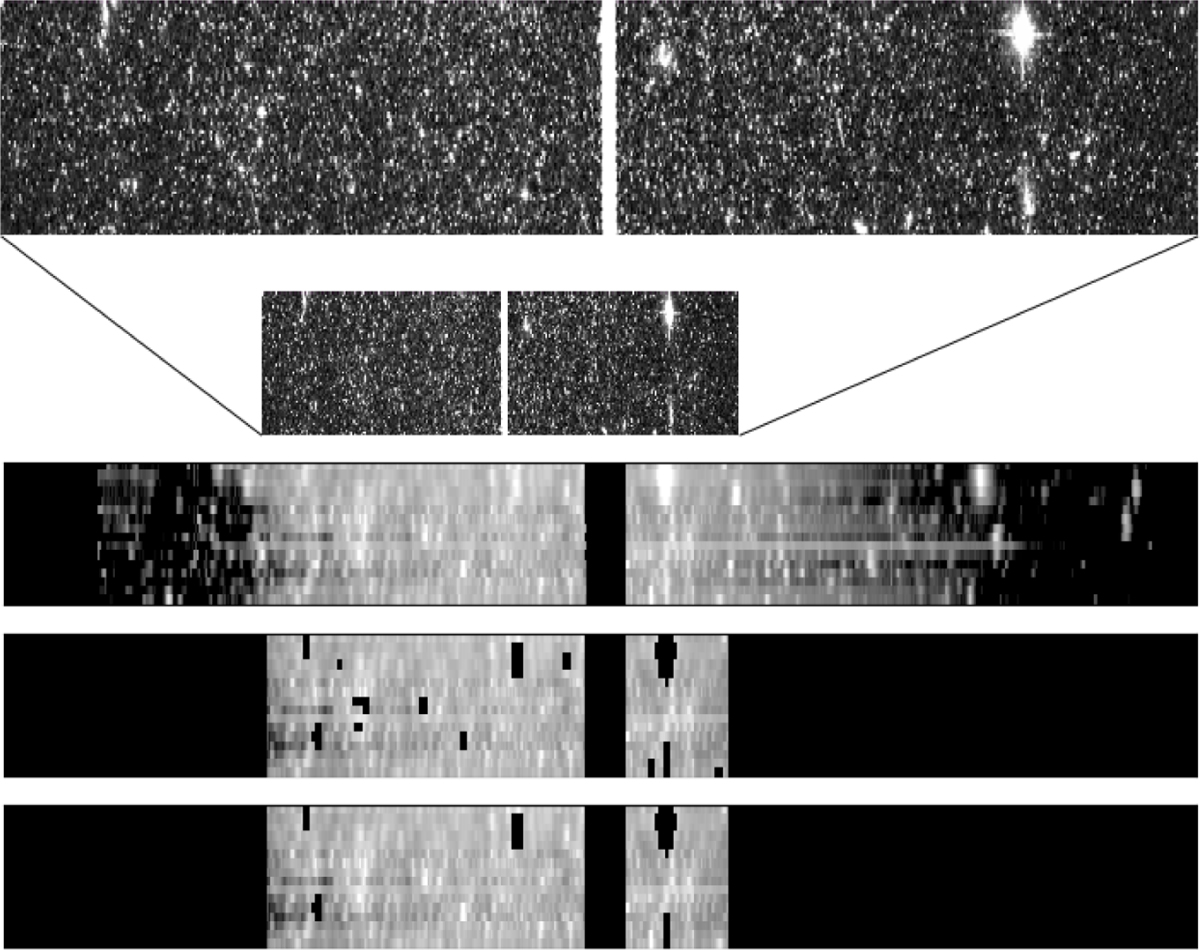
Analysed region and masking procedure. From top to bottom: Rows 1 and 2: high spatial resolution HST image of the scanned region (≃19.2″ × 202″) within the ACS. Rows 3–5: Pseudo-images reconstructed from the 16 slit positions observed with OSIRIS in Leo A. Row 3: entire extension of the observed field (≃19.2″ × 7′). Row 4: region where the integrated spectrum is obtained; in this case we mask background galaxies, saturated stars, and Milky Way star candidates (extraction A). Row 5: region where the integrated spectrum is obtained; in this case we mask just foreground galaxies and saturated stars (extraction B).
Current usage metrics show cumulative count of Article Views (full-text article views including HTML views, PDF and ePub downloads, according to the available data) and Abstracts Views on Vision4Press platform.
Data correspond to usage on the plateform after 2015. The current usage metrics is available 48-96 hours after online publication and is updated daily on week days.
Initial download of the metrics may take a while.