Fig. 7.
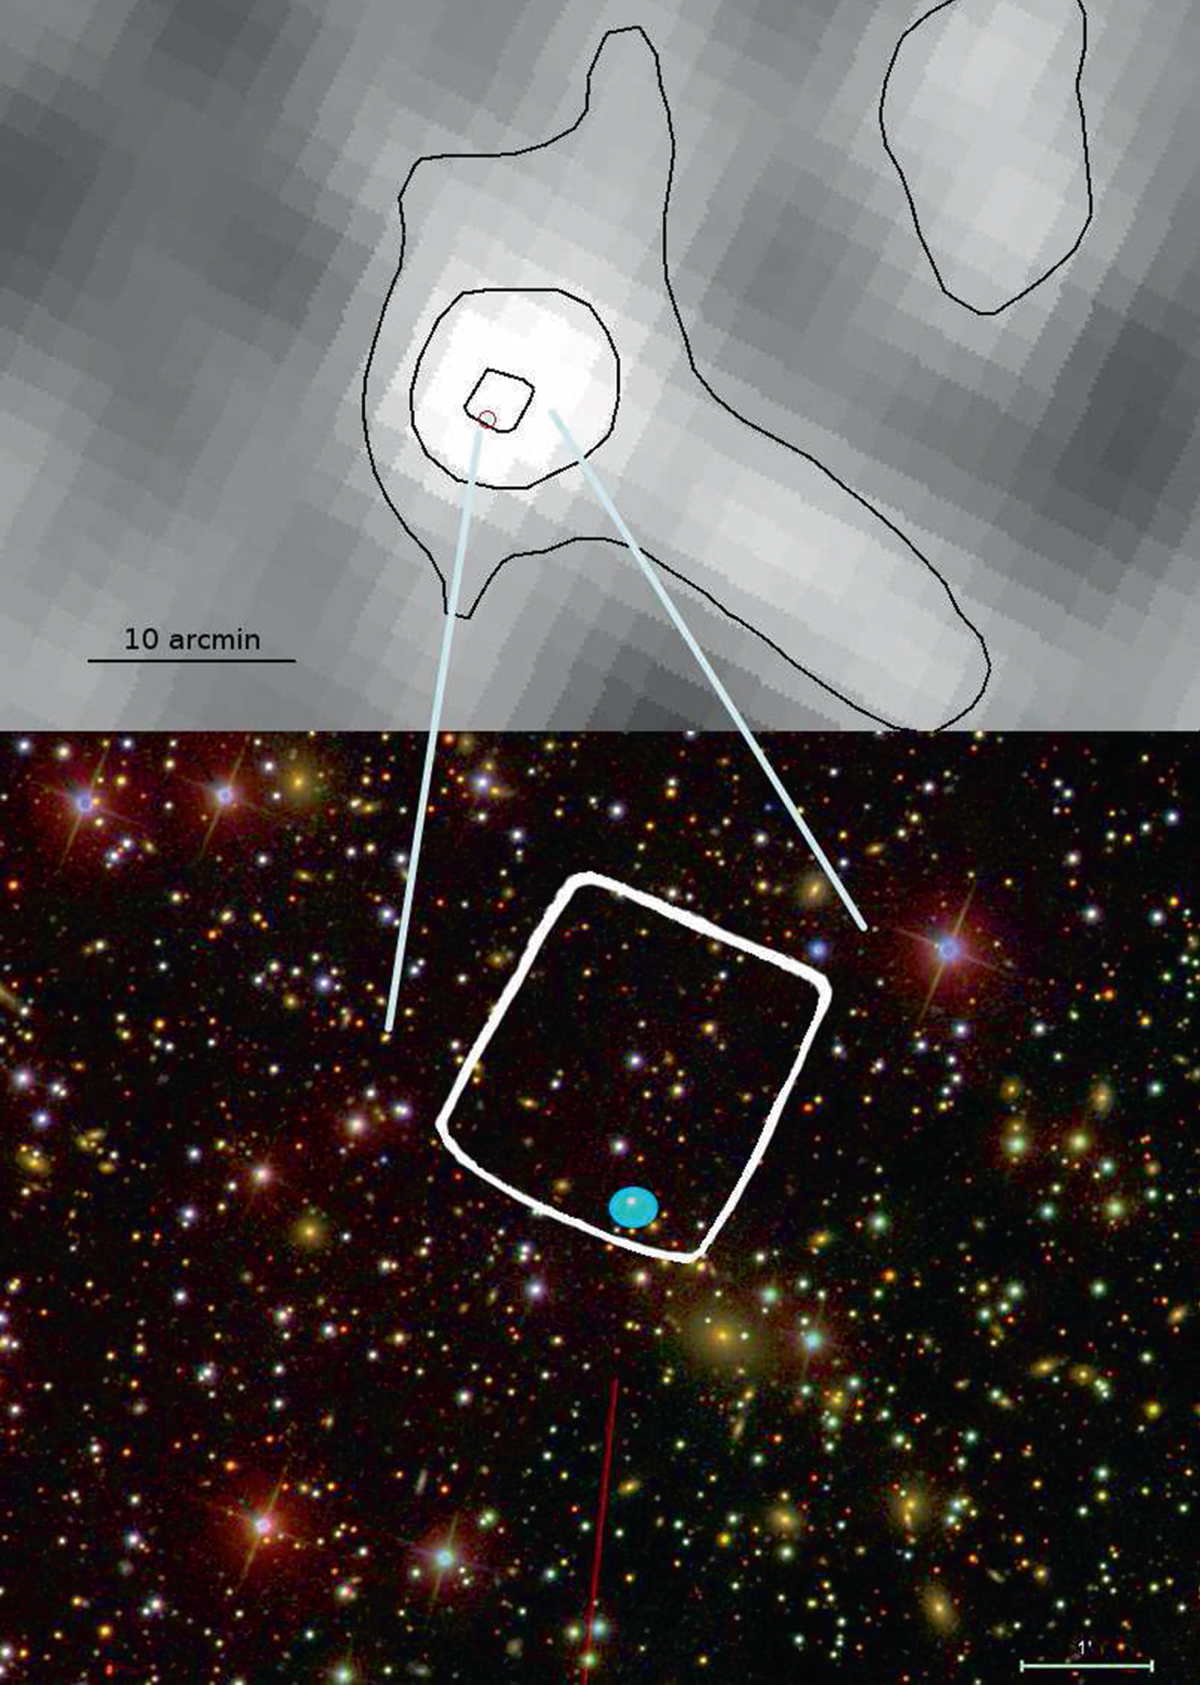
Compton y-map (MILCA) and zoomed RGB SDSS image of the region around PSZ2 G069.35–15.58. The black contours correspond to the 3, 6, 9 × 10⁻⁶ levels of the Compton y-map in this area where the small red circle indicate the nominal Planck position from the PSZ2 catalogue. In the RGB image, the white contour corresponds to the 9 × 10⁻⁶ level and the PSZ2 coordinates. The BCG of this system is clearly placed at less than 1′ to the south-west from the nominal Planck pointing. Potential cluster members are consistent with a zphot ∼ 0.09 and occupy the area of ∼12′ × 12′.
Current usage metrics show cumulative count of Article Views (full-text article views including HTML views, PDF and ePub downloads, according to the available data) and Abstracts Views on Vision4Press platform.
Data correspond to usage on the plateform after 2015. The current usage metrics is available 48-96 hours after online publication and is updated daily on week days.
Initial download of the metrics may take a while.