Fig. 5.
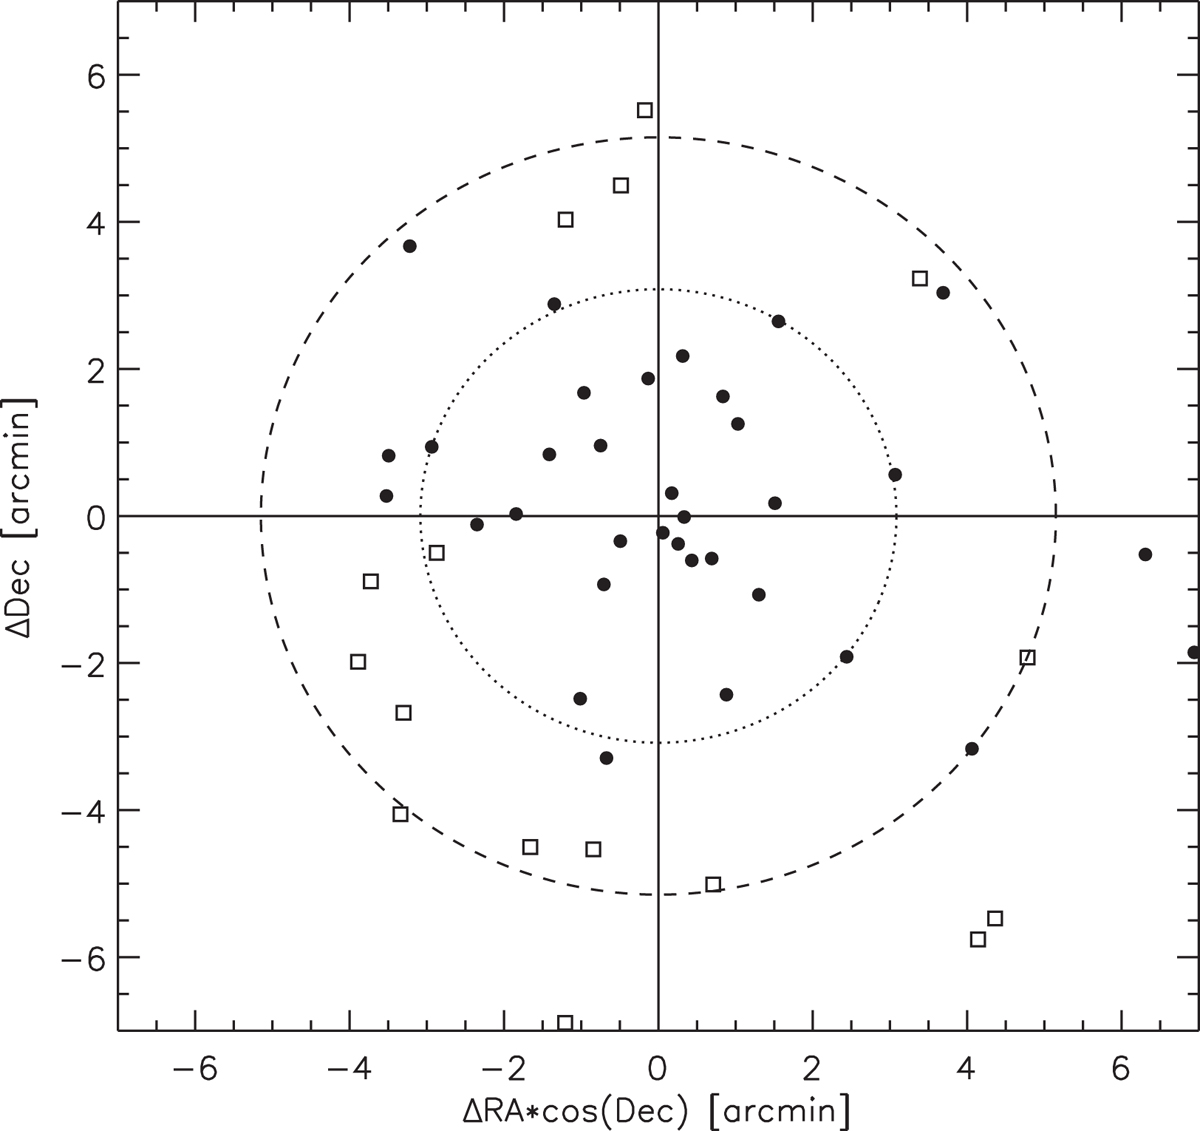
Distribution of the optical centre offsets relative to their Planck SZ positions for the sample of 51 clusters. Thirty-four confirmed clusters included in Table A.1 (dots) and 17 clusters potentially associated with the corresponding PSZ2 source listed in Table A.2 (squares). Inner dashed line corresponds to 3′.1 radius region, which encloses the 68% of the PSZ2 confirmed clusters. External dashed line encloses the 2 × FWHM beam of the Planck SZ detection. Cases with multiple optical counterparts have been excluded from this analysis.
Current usage metrics show cumulative count of Article Views (full-text article views including HTML views, PDF and ePub downloads, according to the available data) and Abstracts Views on Vision4Press platform.
Data correspond to usage on the plateform after 2015. The current usage metrics is available 48-96 hours after online publication and is updated daily on week days.
Initial download of the metrics may take a while.