Fig. 4.
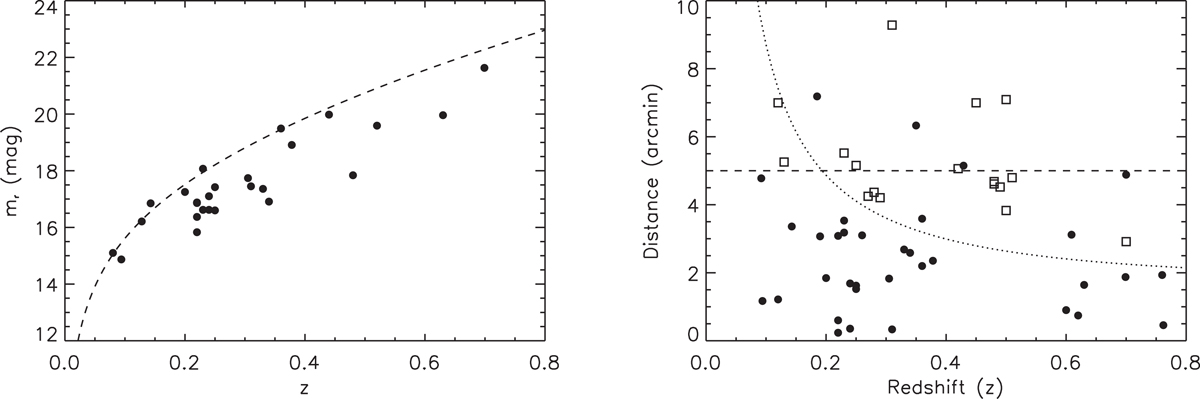
Left: apparent BCG r-band magnitude versus redshift of the complete sample of 54 sources studied in this work. The dashed curve corresponds to the simple prescription ![]() . Right: cluster optical centre offsets relative to their Planck SZ position as a function of cluster redshift for a sample of 51 sources. Cases with multiple optical counterparts have been excluded from this analysis. The dashed horizontal line is 5′, which represents the maximum offset expected for a Planck SZ detection (i.e. 2 × FWHM Planck multi-frequency combined beam). The dotted line corresponds to the physical 1 Mpc radius region at the corresponding redshift. The black dots corresponds to a sample of 34 clusters from Table A.1. These sources fulfil our distance and richness constraints (see Sect. 4). The open squares correspond to 17 clusters that were classified as “potential optical counterparts” (Table A.2).
. Right: cluster optical centre offsets relative to their Planck SZ position as a function of cluster redshift for a sample of 51 sources. Cases with multiple optical counterparts have been excluded from this analysis. The dashed horizontal line is 5′, which represents the maximum offset expected for a Planck SZ detection (i.e. 2 × FWHM Planck multi-frequency combined beam). The dotted line corresponds to the physical 1 Mpc radius region at the corresponding redshift. The black dots corresponds to a sample of 34 clusters from Table A.1. These sources fulfil our distance and richness constraints (see Sect. 4). The open squares correspond to 17 clusters that were classified as “potential optical counterparts” (Table A.2).
Current usage metrics show cumulative count of Article Views (full-text article views including HTML views, PDF and ePub downloads, according to the available data) and Abstracts Views on Vision4Press platform.
Data correspond to usage on the plateform after 2015. The current usage metrics is available 48-96 hours after online publication and is updated daily on week days.
Initial download of the metrics may take a while.