Fig. 2.
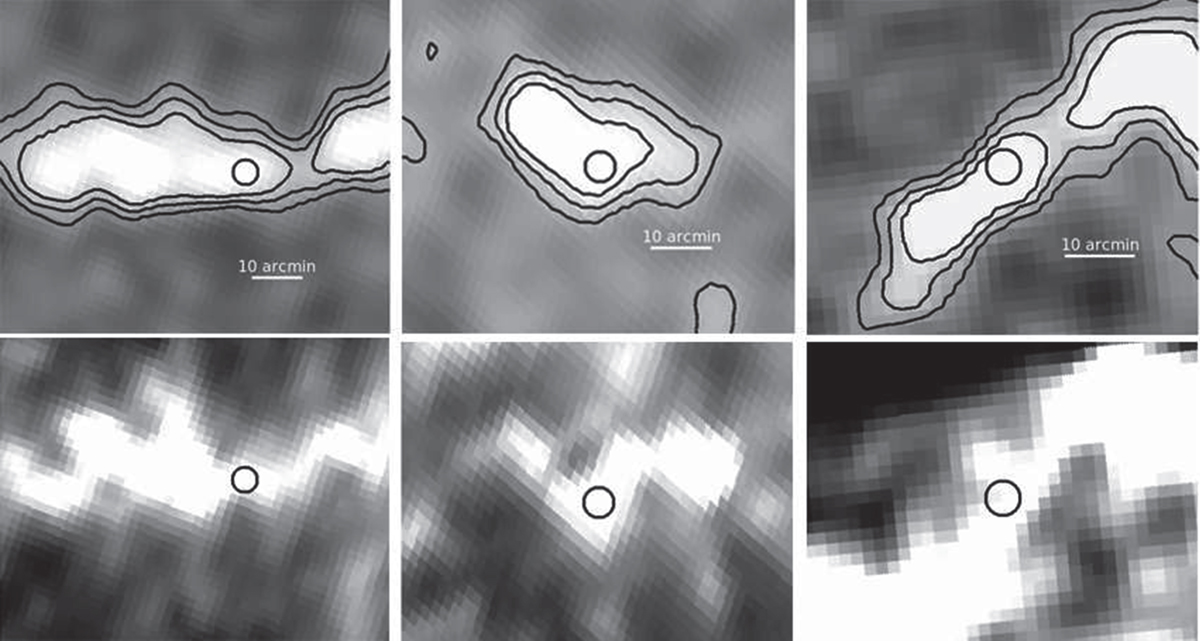
Three examples of Planck clusters in which the SZ signal seems to be strongly influenced by Galactic dust contamination. From left to right three columns correspond to PSZ2 G029.87–17.81, PSZ2 G148.60–48.61, and PSZ2 G179.33–22.22, respectively. We present for each source Compton y-map (top row) together with the corresponding Planck 857 GHz map (bottom row). These clusters have S/N ∼ 5 in the PSZ2 catalogue. Black contours correspond to the 3, 6 and 12 × 10−6 levels of the Compton y-maps in this area. No obvious peak at the nominal position of Planck sources (showed as black circles) is evident in these three cases. The 857 GHz map for each source suggests that most of the emission arises from dust. The SZ flux profile follows an elongated structure that coincided with the direction of a dust Galactic filament. While the possibility exists that cluster counterparts correspond to high-z clusters, in the absence of deeper data we classify these as false SZ detections.
Current usage metrics show cumulative count of Article Views (full-text article views including HTML views, PDF and ePub downloads, according to the available data) and Abstracts Views on Vision4Press platform.
Data correspond to usage on the plateform after 2015. The current usage metrics is available 48-96 hours after online publication and is updated daily on week days.
Initial download of the metrics may take a while.