Fig. 2.
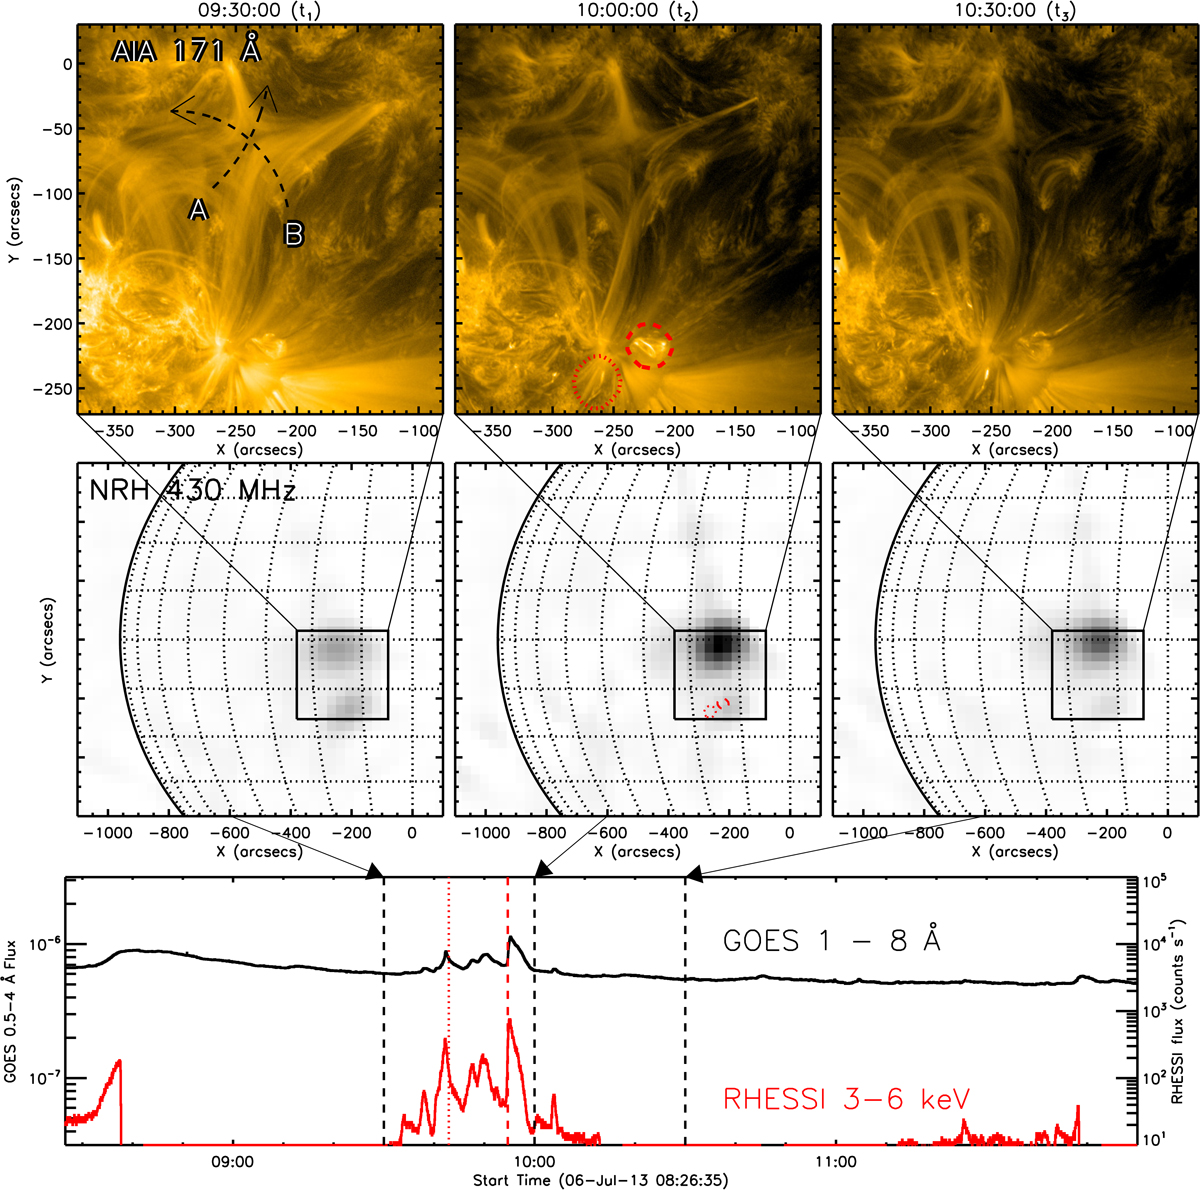
Overview of the collapse of the X-shaped coronal structure. Top: AIA 171 Å images covering the 90 min surrounding the collapse. Overlaid on the earliest image are the slices used to generate the time-distance plots shown in Fig. 2. Slices A and B are 67 arcsec and 96 arcsec long, respectively; the arrow denotes the reference direction for the time-distance plots. Middle: NRH 430 MHz images showing the Type I storm source at the times of the above images. Overlaid is the field of view of the AIA images. Bottom: GOES 1–12 keV and RHESSI 3–6 keV light curves, showing the flares that occurred during the collapse. An animation of the collapse in AIA 171 Å data is available online.
Current usage metrics show cumulative count of Article Views (full-text article views including HTML views, PDF and ePub downloads, according to the available data) and Abstracts Views on Vision4Press platform.
Data correspond to usage on the plateform after 2015. The current usage metrics is available 48-96 hours after online publication and is updated daily on week days.
Initial download of the metrics may take a while.