Fig. 1.
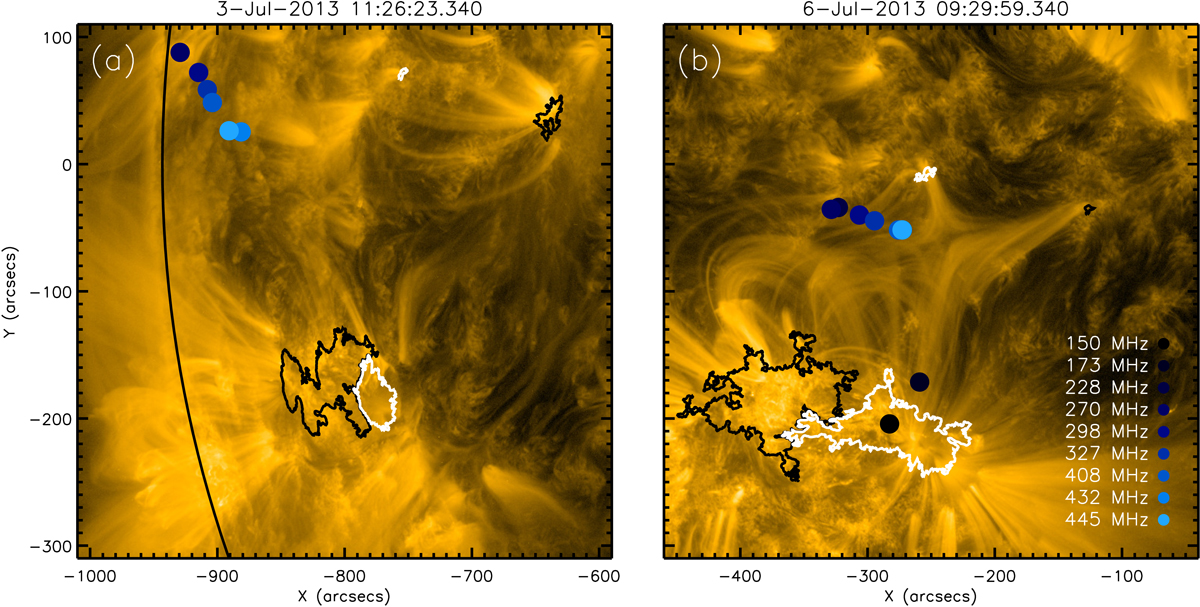
Evolution of active region AR11785 during its approach towards disk centre. AIA 171 Å images are shown at times when the active region is (panel a) near to the eastern limb and (panel b) near to disk centre. The location and polarity of the underlying line-of-sight magnetic field from HMI are shown in black for negative polarity, and white for positive polarity. These contours represent 80 G in the associated HMI images. Overlaid as blue circles are the location of Type I noise storm source centroids at all available frequencies from 150 to 445 MHz.
Current usage metrics show cumulative count of Article Views (full-text article views including HTML views, PDF and ePub downloads, according to the available data) and Abstracts Views on Vision4Press platform.
Data correspond to usage on the plateform after 2015. The current usage metrics is available 48-96 hours after online publication and is updated daily on week days.
Initial download of the metrics may take a while.