Fig. 8.
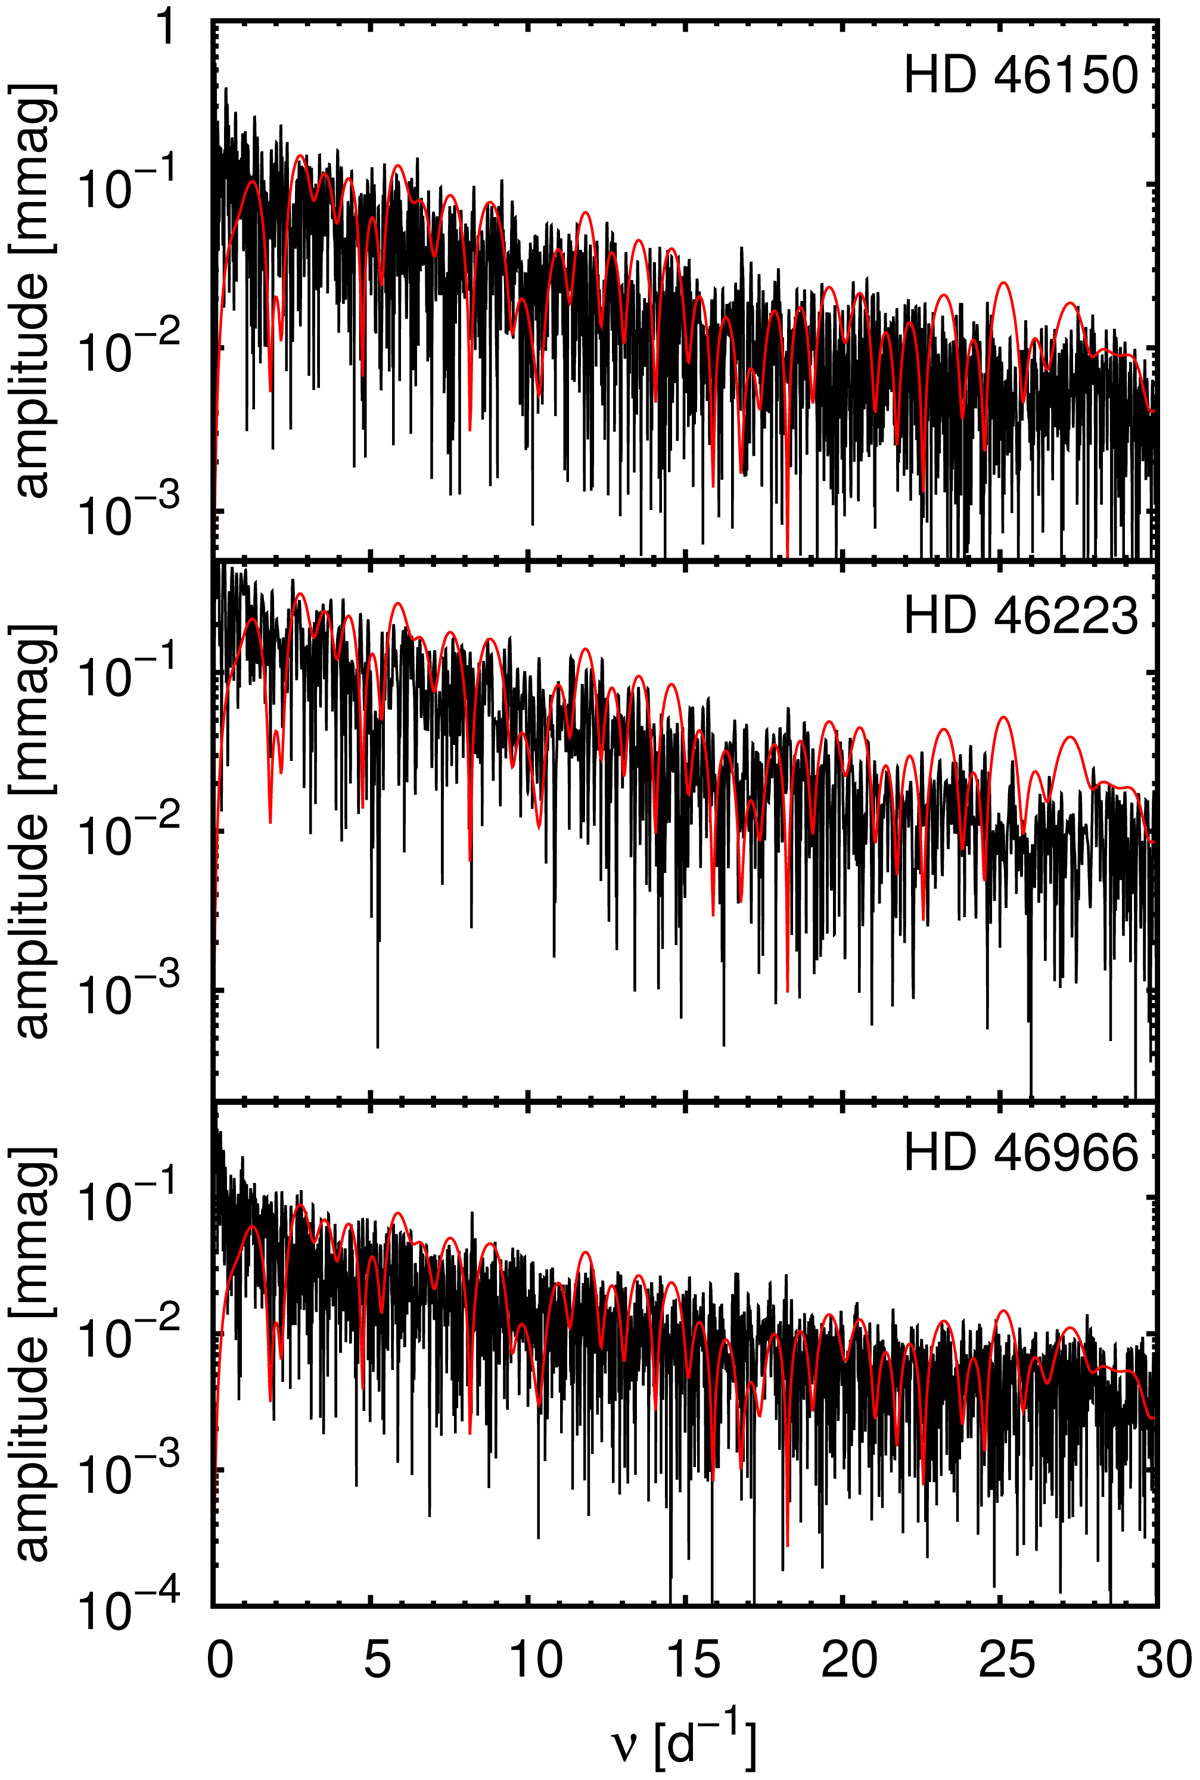
Comparison of the Fourier spectra of light curves given in Fig. 7 (black curves) with Fourier spectrum of the theoretical light curve for N = 1 (red curves). The theoretical spectrum was scaled by a factor of 10b taken from Table 1 accounting for N > 1. For the analysis we used the CoRoT light curves secured between JD 2456203 and 2456234 for HD 46150 and HD 46223 and between JD 2454748 and 2454783 for HD 46966.
Current usage metrics show cumulative count of Article Views (full-text article views including HTML views, PDF and ePub downloads, according to the available data) and Abstracts Views on Vision4Press platform.
Data correspond to usage on the plateform after 2015. The current usage metrics is available 48-96 hours after online publication and is updated daily on week days.
Initial download of the metrics may take a while.