Fig. A.1.
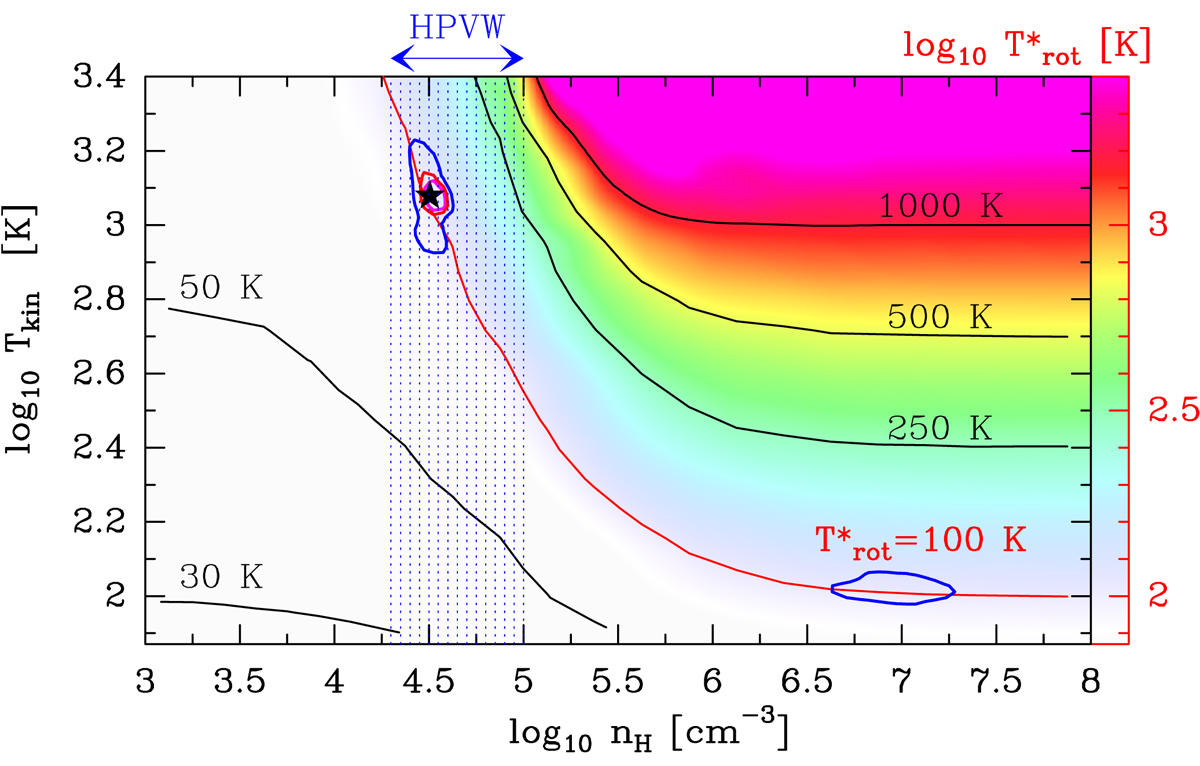
12CO rotational temperatures (![]() , computed by fitting a straight line to synthetic line intensities in the Jup = 5−10 range) obtained from isothermal non-LTE models. The red curve shows the parameter space that reproduces the observed Trot of the HPVW component. The blue-shaded area shows the estimated gas density of the high-velocity cloudlets detected by ALMA (Goicoechea et al. 2018). The magenta, red, and blue curves show rmsmin/rms contours of 1, 0.95, and 0.9 respectively, where rms refers to the rms value of log10 (IHIFI/Imod).
, computed by fitting a straight line to synthetic line intensities in the Jup = 5−10 range) obtained from isothermal non-LTE models. The red curve shows the parameter space that reproduces the observed Trot of the HPVW component. The blue-shaded area shows the estimated gas density of the high-velocity cloudlets detected by ALMA (Goicoechea et al. 2018). The magenta, red, and blue curves show rmsmin/rms contours of 1, 0.95, and 0.9 respectively, where rms refers to the rms value of log10 (IHIFI/Imod).
Current usage metrics show cumulative count of Article Views (full-text article views including HTML views, PDF and ePub downloads, according to the available data) and Abstracts Views on Vision4Press platform.
Data correspond to usage on the plateform after 2015. The current usage metrics is available 48-96 hours after online publication and is updated daily on week days.
Initial download of the metrics may take a while.