Free Access
Fig. 4.
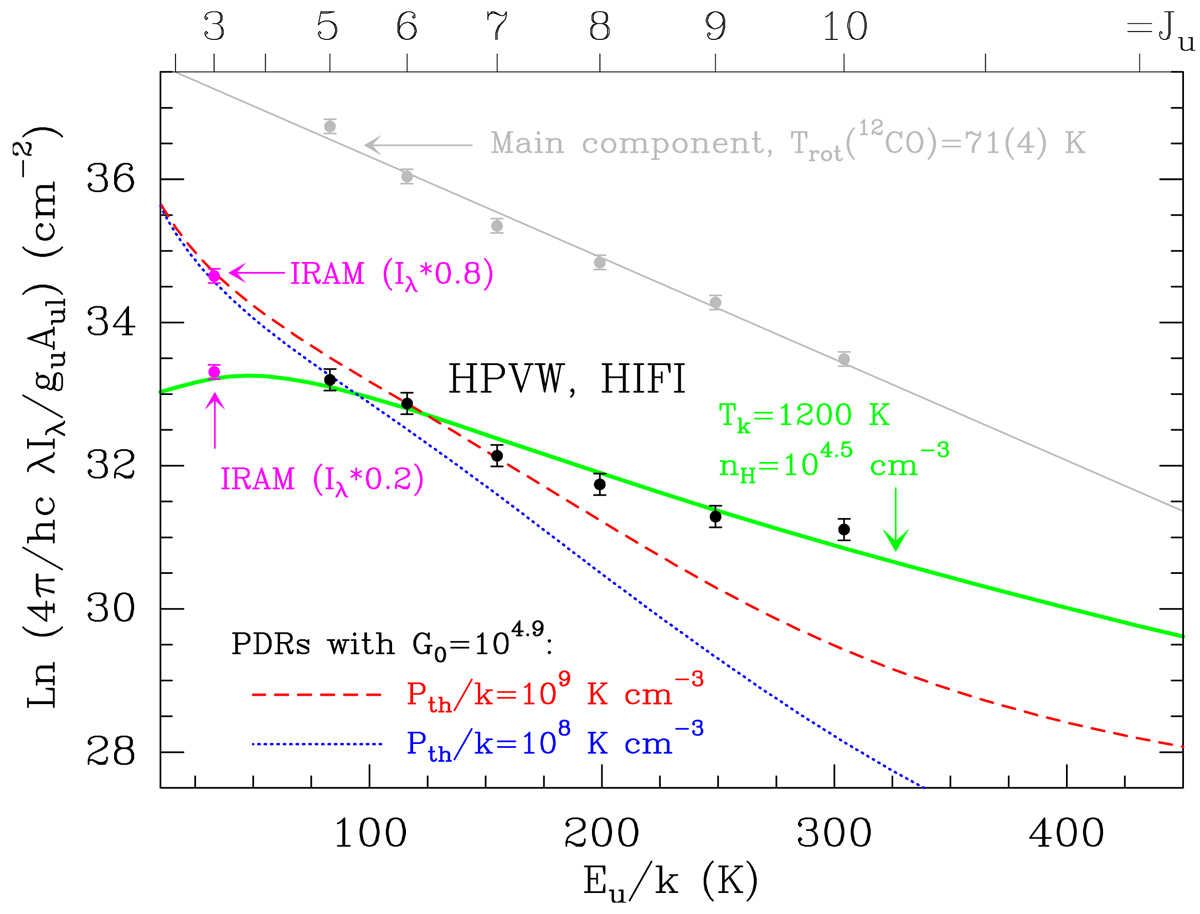
Observed CO intensities of the main and HPVW components toward Sgr A* translated to rotational population diagrams. The green curve shows the best isothermal non-LTE model. The red and blue dashed curves show predictions of PDR models with G0 = 104.9 and ζCR = 10−15 s−1 (line intensities multiplied by 0.04).
Current usage metrics show cumulative count of Article Views (full-text article views including HTML views, PDF and ePub downloads, according to the available data) and Abstracts Views on Vision4Press platform.
Data correspond to usage on the plateform after 2015. The current usage metrics is available 48-96 hours after online publication and is updated daily on week days.
Initial download of the metrics may take a while.