Free Access
Fig. 2.
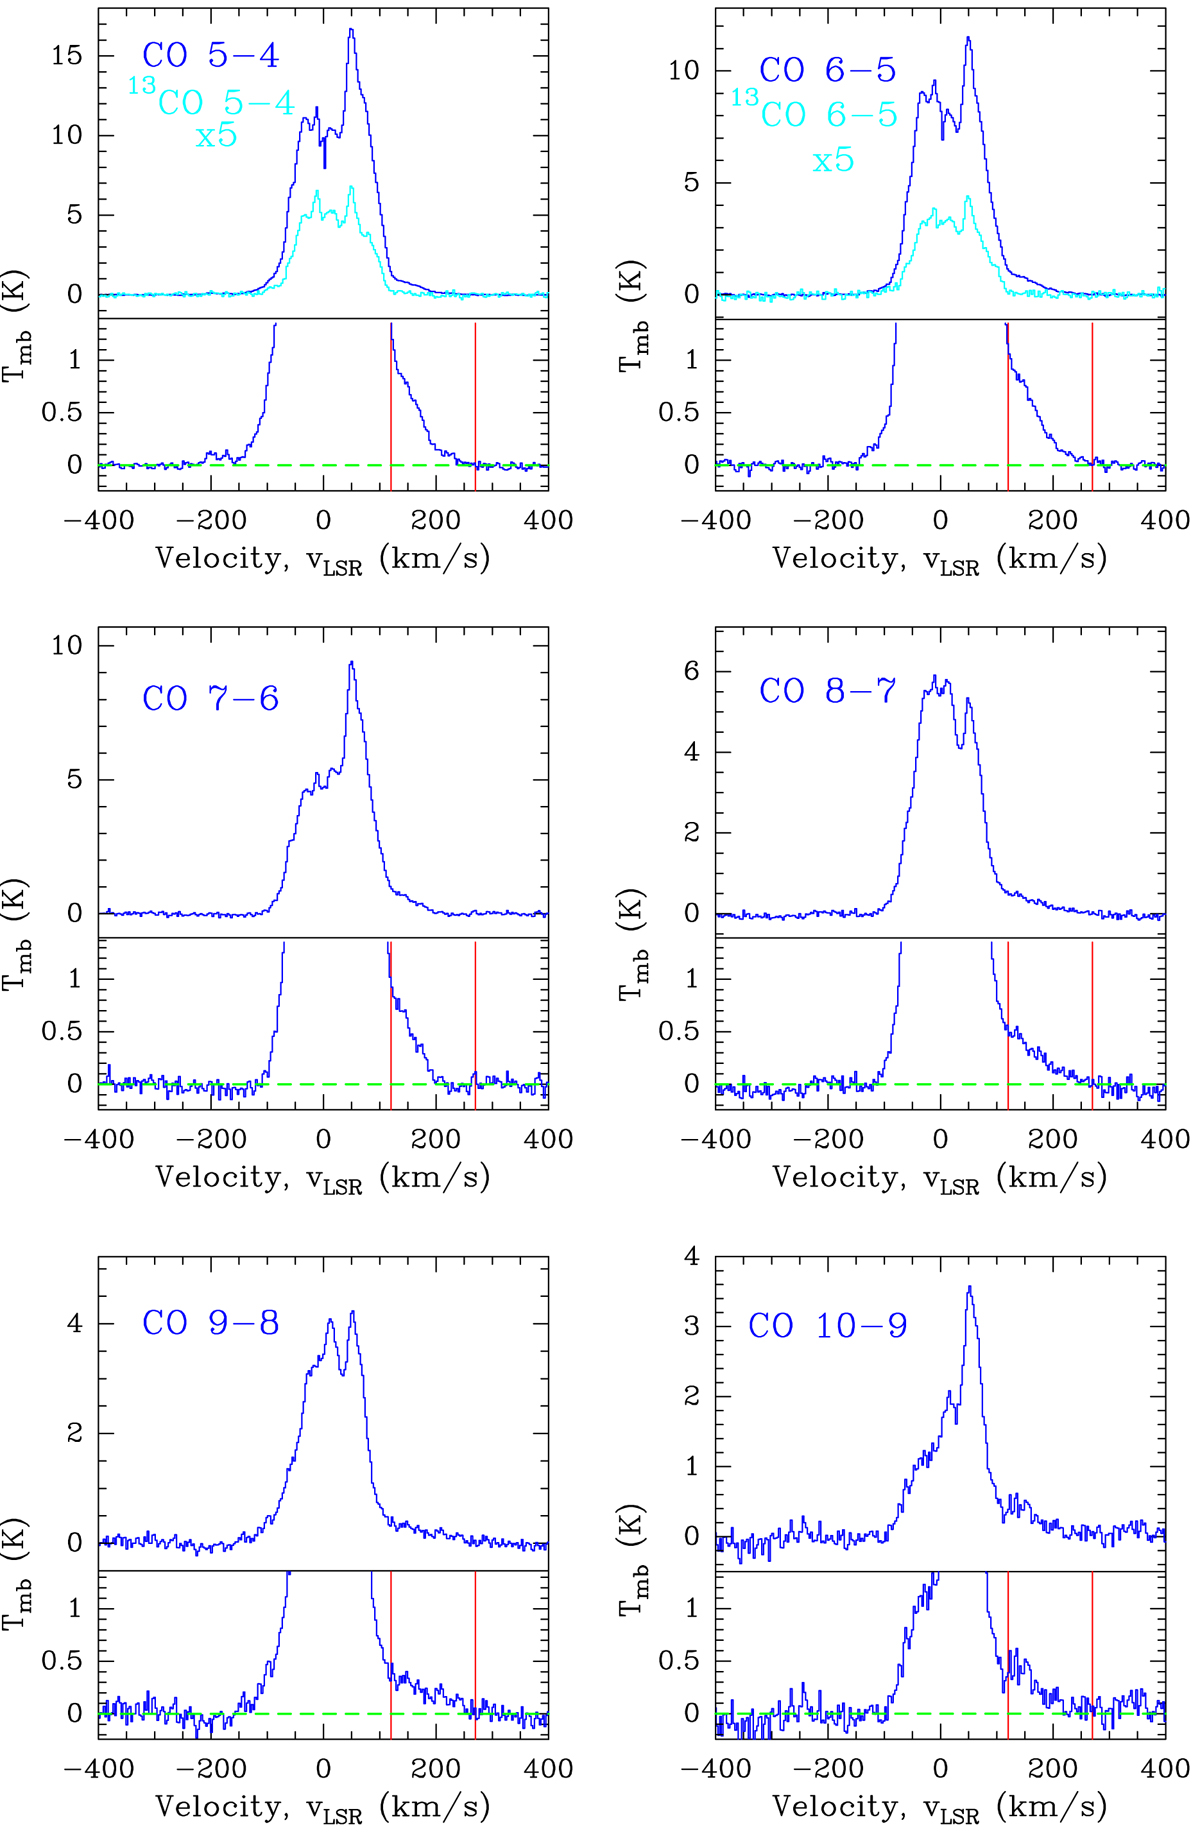
Mid-J12CO and 13CO lines observed with HIFI toward Sgr A* (baseline subtracted). The two red vertical lines at υLSR ≃+120 and +270 km−1 delineate the HPVW emission.
Current usage metrics show cumulative count of Article Views (full-text article views including HTML views, PDF and ePub downloads, according to the available data) and Abstracts Views on Vision4Press platform.
Data correspond to usage on the plateform after 2015. The current usage metrics is available 48-96 hours after online publication and is updated daily on week days.
Initial download of the metrics may take a while.