Fig. 2.
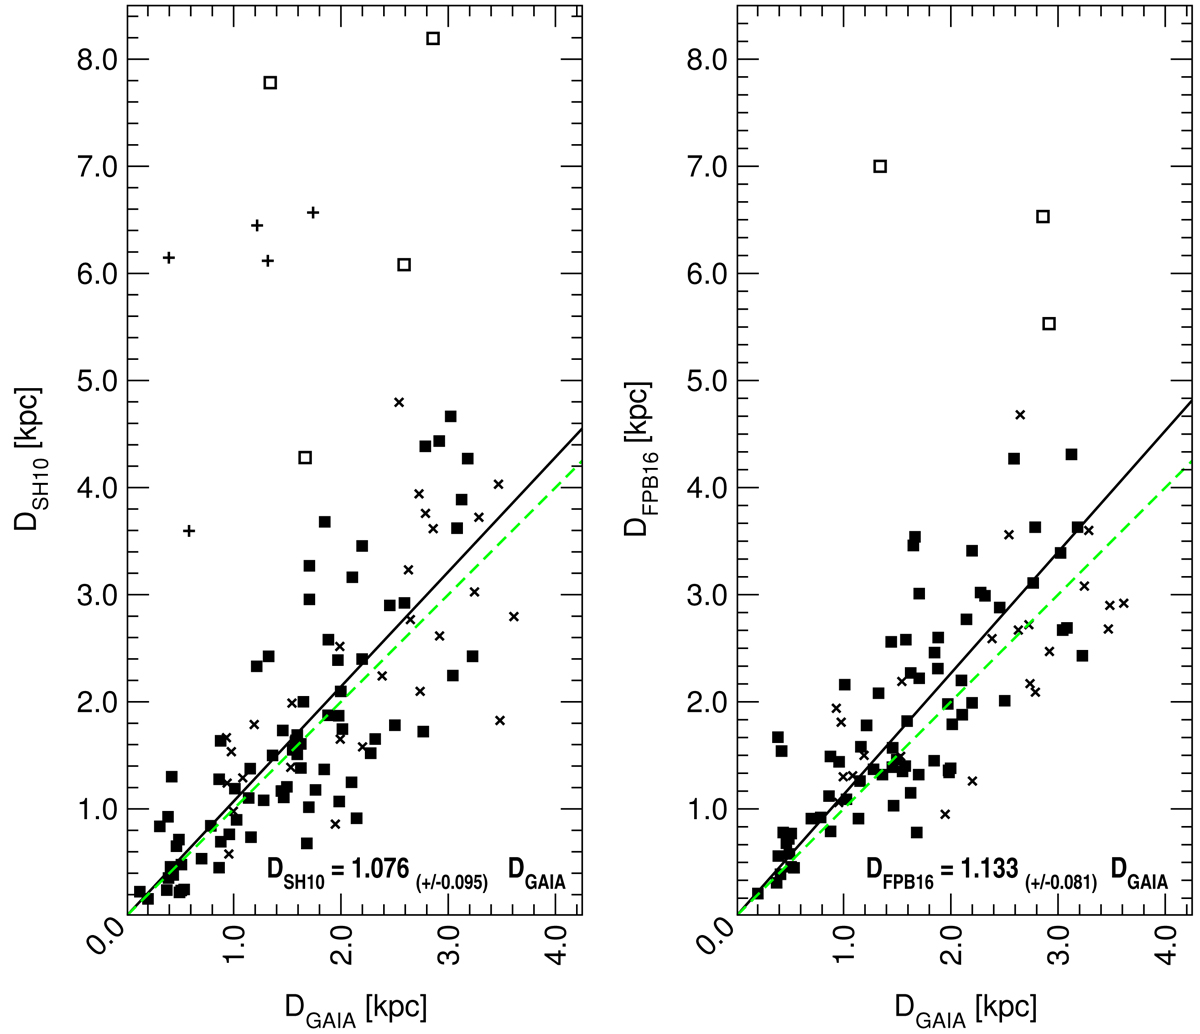
Comparison with statistical distance scales. We show the catalog of distances by SH10 and FPB16 against GDR2 distances. Filled and empty squares show the data for targets with σπ/π < 0.15 in Gaia, where open symbols indicate the sources that we did not use for the regression (2.5σ filtering). The black solid lines show the linear regression of these sources forced through the coordinate origin. Crosses and pluses are used for targets with 0.15 ≤ σπ/π < 0.25, (the latter were not included in the fitting), where filtered sources are marked with a plus. The fitting including sources with σπ/π > 0.15 marginally changed the result within the line widths and thus is not shown separately for clarity. The green dashed lines show the 1:1 relation.
Current usage metrics show cumulative count of Article Views (full-text article views including HTML views, PDF and ePub downloads, according to the available data) and Abstracts Views on Vision4Press platform.
Data correspond to usage on the plateform after 2015. The current usage metrics is available 48-96 hours after online publication and is updated daily on week days.
Initial download of the metrics may take a while.