Fig. 4.
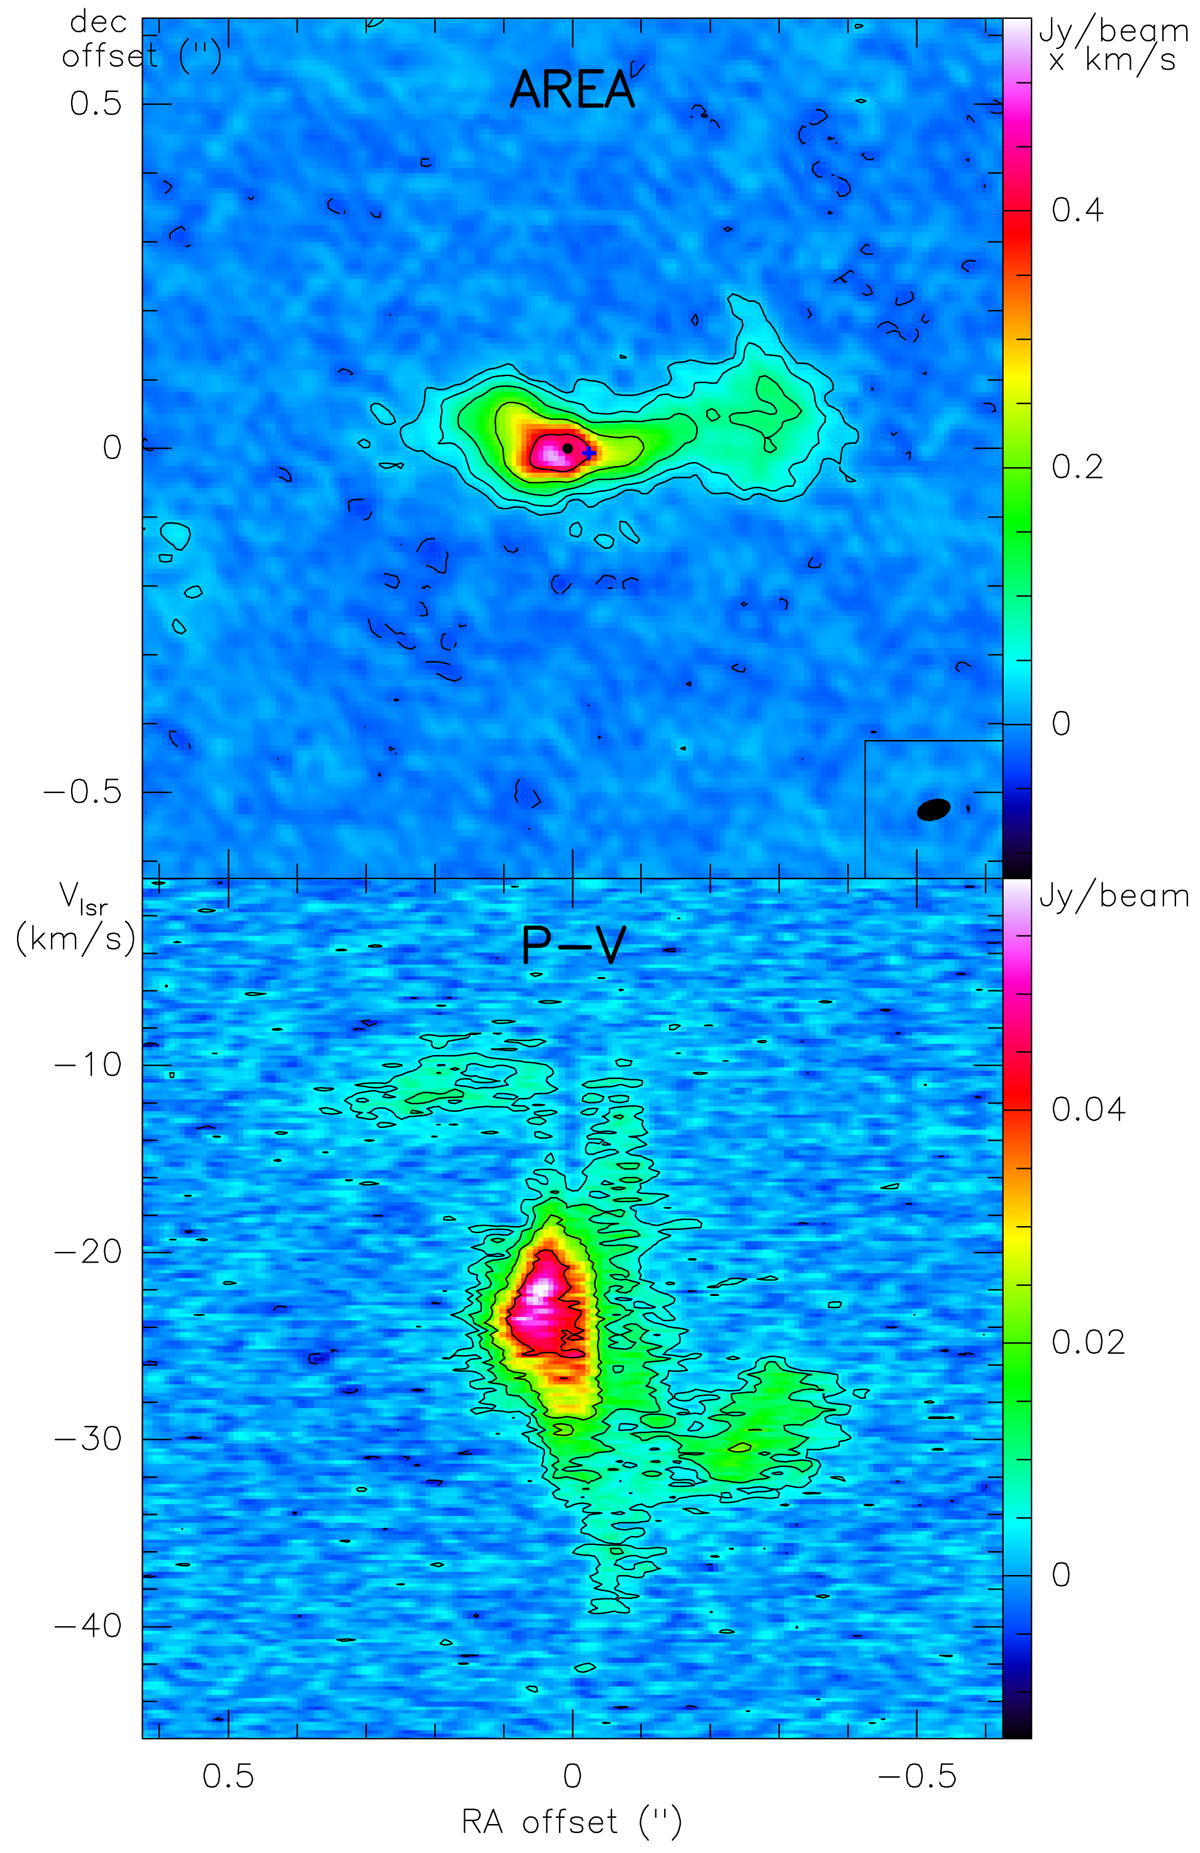
Top panel: map of the 12CO J = 3−2 velocity-integrated brightness in R Aqr. Contours are logarithmic, the first contour is ±0.025 Jy beam−1 × km s−1 and the jump is a factor 2. Dashed contours represent negative values. Bottom panel: position-velocity diagram for an east–west central cut.
Current usage metrics show cumulative count of Article Views (full-text article views including HTML views, PDF and ePub downloads, according to the available data) and Abstracts Views on Vision4Press platform.
Data correspond to usage on the plateform after 2015. The current usage metrics is available 48-96 hours after online publication and is updated daily on week days.
Initial download of the metrics may take a while.