Fig. 4
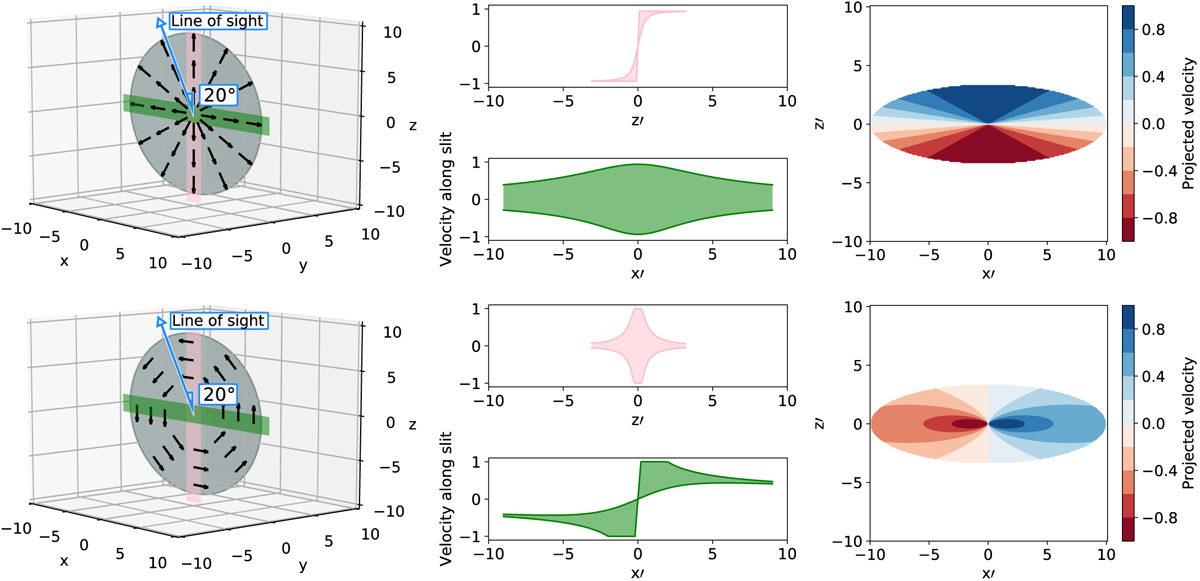
Demonstrating the degeneracy between observations of rotation and expansion in a thin layer. Left panel: system orientation. Middle panel: velocity-position diagrams generated across the pink and green region marked in the left figure. Right panel: velocity distribution across the sky when the system is viewed at an angle 20° below edge on, i.e., the angle between the line of sight and the orbital plane in the R Aqr system.
Current usage metrics show cumulative count of Article Views (full-text article views including HTML views, PDF and ePub downloads, according to the available data) and Abstracts Views on Vision4Press platform.
Data correspond to usage on the plateform after 2015. The current usage metrics is available 48-96 hours after online publication and is updated daily on week days.
Initial download of the metrics may take a while.