Fig. 3
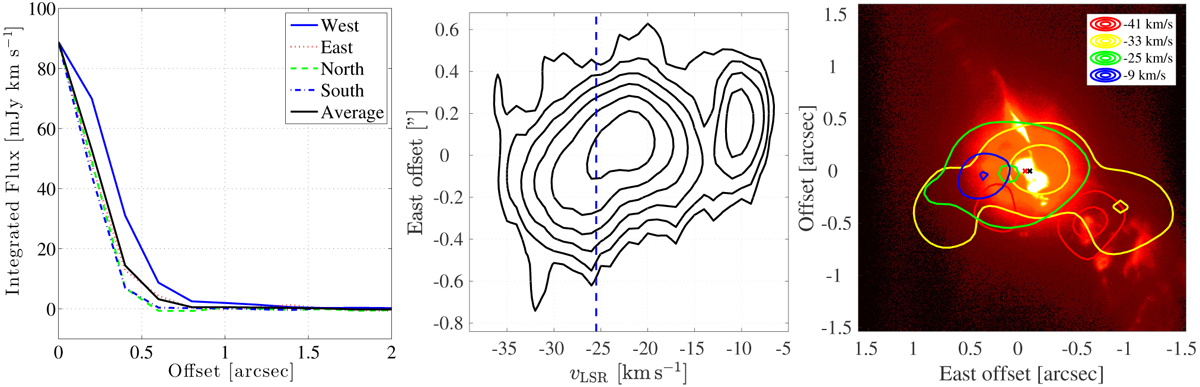
Left panel: CO(3–2) line brightness measured every 0.′′2 east, west, north, and south from the brightest pixel. Middle panel: PV diagram of the CO(3–2) emission measured across a thin slit in the east–west directions. The contours are the same as in Fig. 2. The dashed blue line marks the average radial velocity of the Mira star according to Gromadzki & Mikołajewska (2009). Right panel: contours of the different main features at different velocities (shown in the legend) of the CO gas distribution overlaid on the Hα image from Schmid et al. (2017), showing the jet and the resolved binary pair. The AGB star and white dwarf are marked by a red and a blue cross, respectively.
Current usage metrics show cumulative count of Article Views (full-text article views including HTML views, PDF and ePub downloads, according to the available data) and Abstracts Views on Vision4Press platform.
Data correspond to usage on the plateform after 2015. The current usage metrics is available 48-96 hours after online publication and is updated daily on week days.
Initial download of the metrics may take a while.