Fig. 2
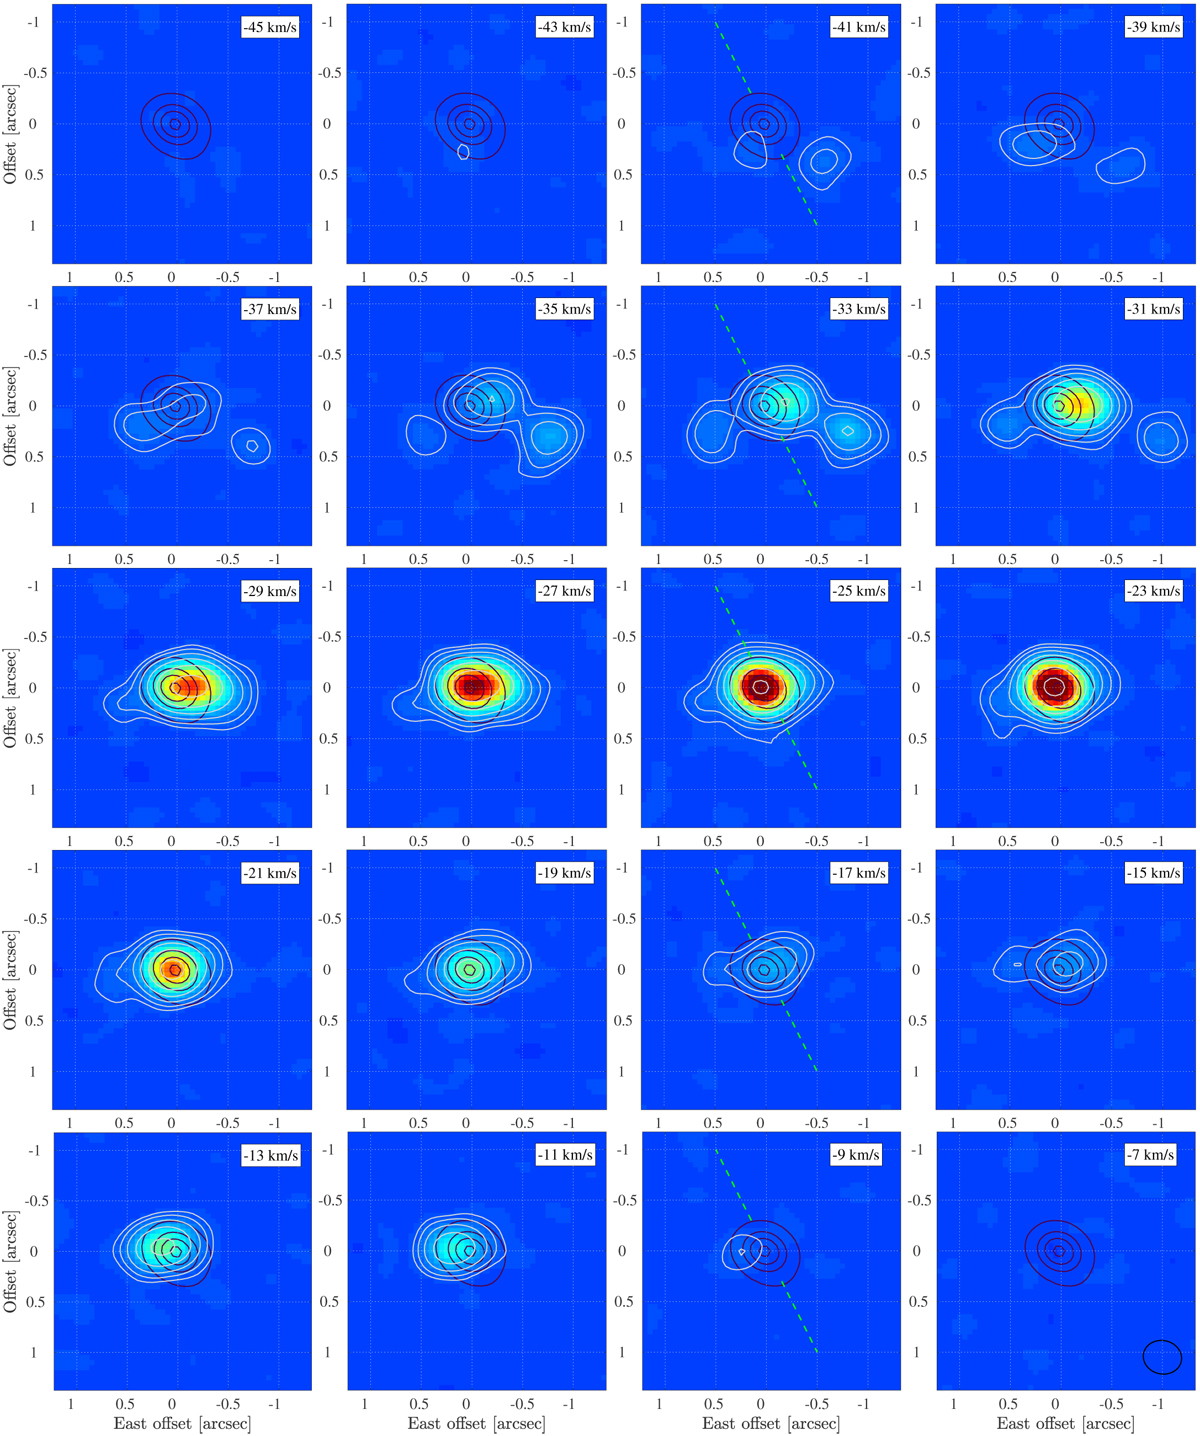
Images of the resolved 12CO(3–2) emission in different velocity channels (line-of-sight velocity indicated in the upper right corner). Thicker (maroon) contours centered at (0,0) show the unresolved continuum emission. Thinner (light gray) contours and the color scale show the line emission. The contours are drawn at 3, 6, 12, 24, etc. times the rms noise level in the emission-free channels. The images show the three-peaked, extended emission in the blueshifted channels, and the movement of the emission peak from west to east when moving from blue to red velocities. The (green) dashed line in the third-column images shows the direction of the jet (Schmid et al. 2017).
Current usage metrics show cumulative count of Article Views (full-text article views including HTML views, PDF and ePub downloads, according to the available data) and Abstracts Views on Vision4Press platform.
Data correspond to usage on the plateform after 2015. The current usage metrics is available 48-96 hours after online publication and is updated daily on week days.
Initial download of the metrics may take a while.