Fig. 1
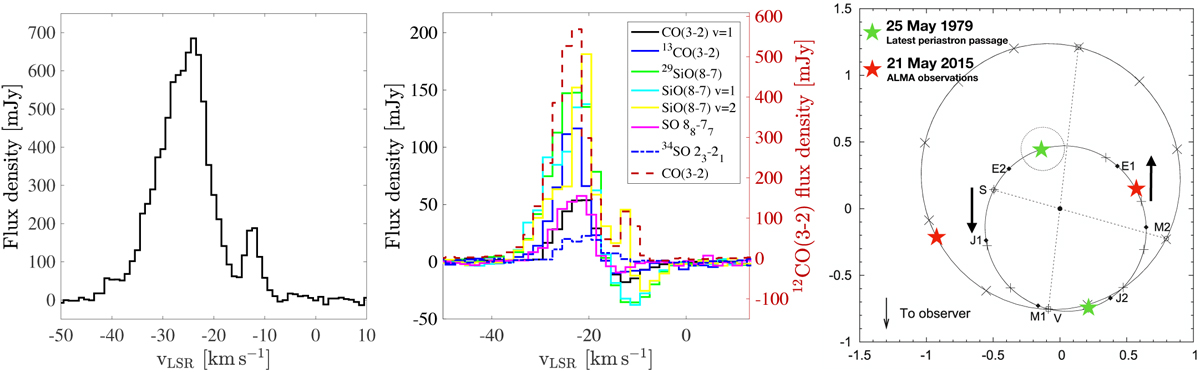
Left panel: 12CO(3–2) line detected toward R Aqr with ALMA. The line is generated from channel maps with 1 km s−1 spectral resolution and measured across a 3′′ aperture centered on the continuum emission peak. Middle panel: line emission from the lines listed in Table 2. All lines (including 12CO(3–2)) are generated at one pixel coincident with the continuum emission peak, and at 2 km s−1 spectral resolution. Right panel: orbits of the binary pair as derived by Gromadzki & Mikołajewska (2009). Both the Mira star (+) and the hot component (×) move anticlockwise in this representation, and the center of mass is marked by the solid dot. The axes unit is the system semimajor axis, a (~15.5 AU according to Gromadzki & Mikołajewska 2009). For details see Gromadzki & Mikołajewska (2009). The position of the stars at the latest periastron passage (green stars) and the time of the ALMA observations (red stars) have been added. The base of the thick arrows marks the times of maximum velocity approach and retreat of the Mira star from the observer.
Current usage metrics show cumulative count of Article Views (full-text article views including HTML views, PDF and ePub downloads, according to the available data) and Abstracts Views on Vision4Press platform.
Data correspond to usage on the plateform after 2015. The current usage metrics is available 48-96 hours after online publication and is updated daily on week days.
Initial download of the metrics may take a while.