Free Access
Fig. 8
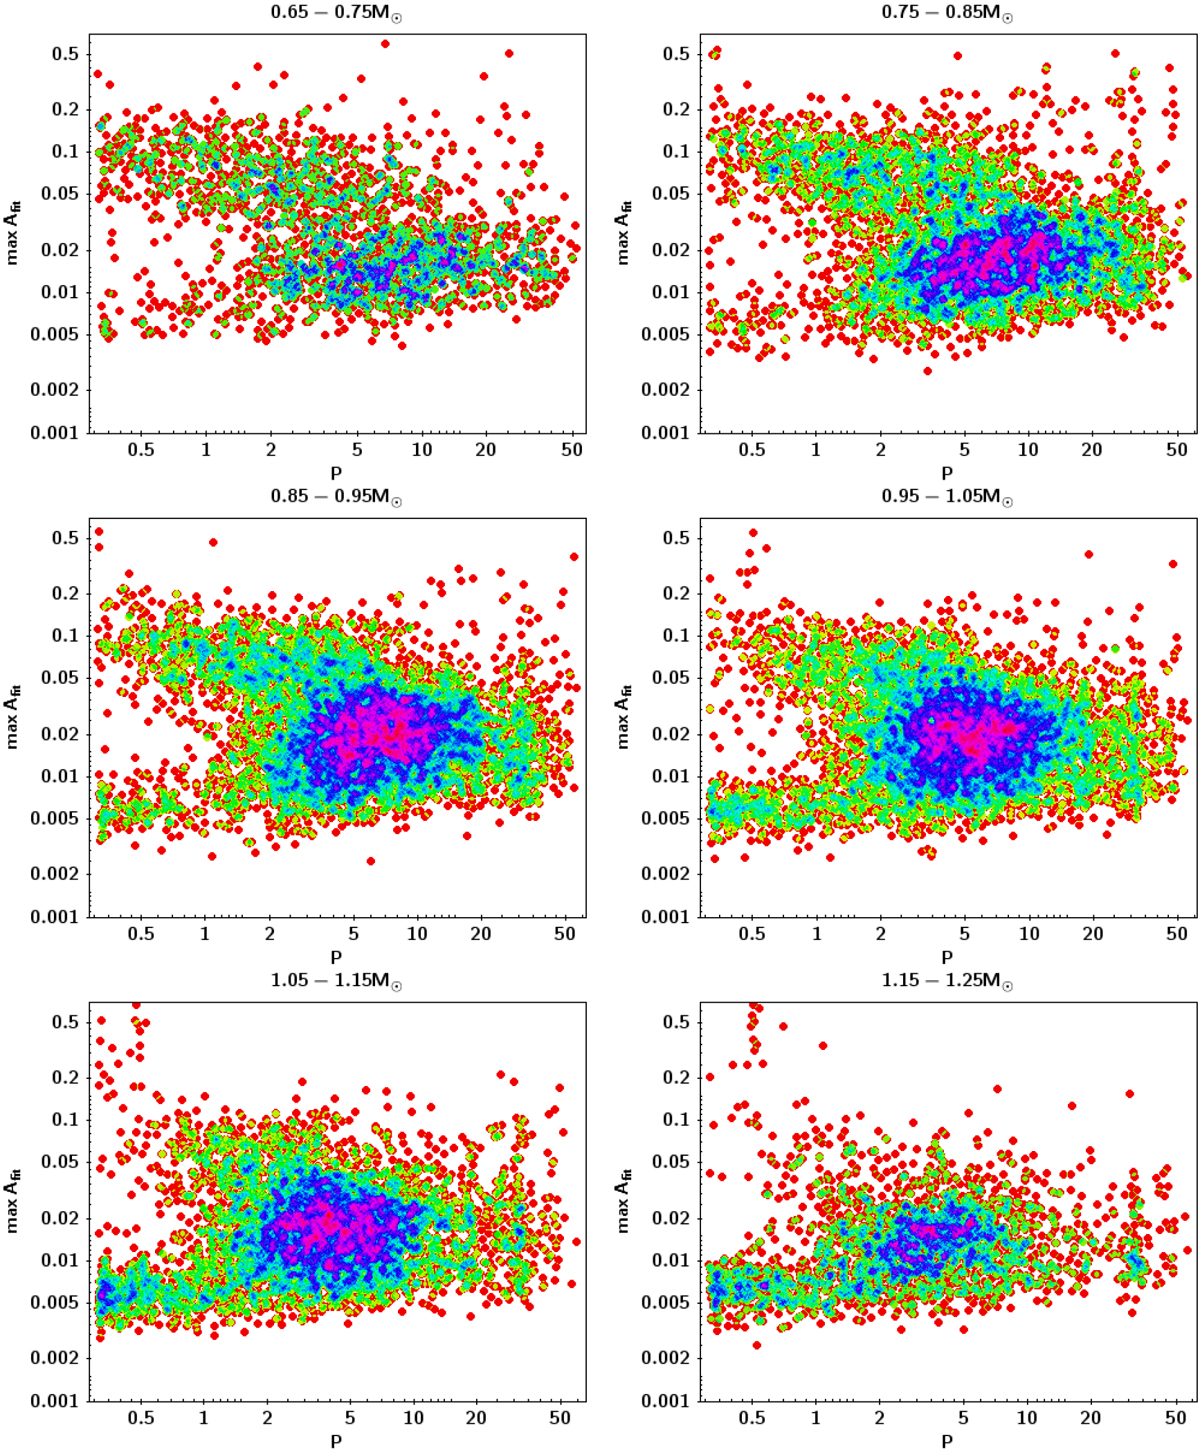
Amplitude-period diagrams in bins of approximate mass showing a bimodality in modulation amplitude. The colour coding gives an indication of the relative density of the data points (red for lower-density, and purple for higher density). Amplitude units are mag., and P is given in day units.
Current usage metrics show cumulative count of Article Views (full-text article views including HTML views, PDF and ePub downloads, according to the available data) and Abstracts Views on Vision4Press platform.
Data correspond to usage on the plateform after 2015. The current usage metrics is available 48-96 hours after online publication and is updated daily on week days.
Initial download of the metrics may take a while.