Fig. 6
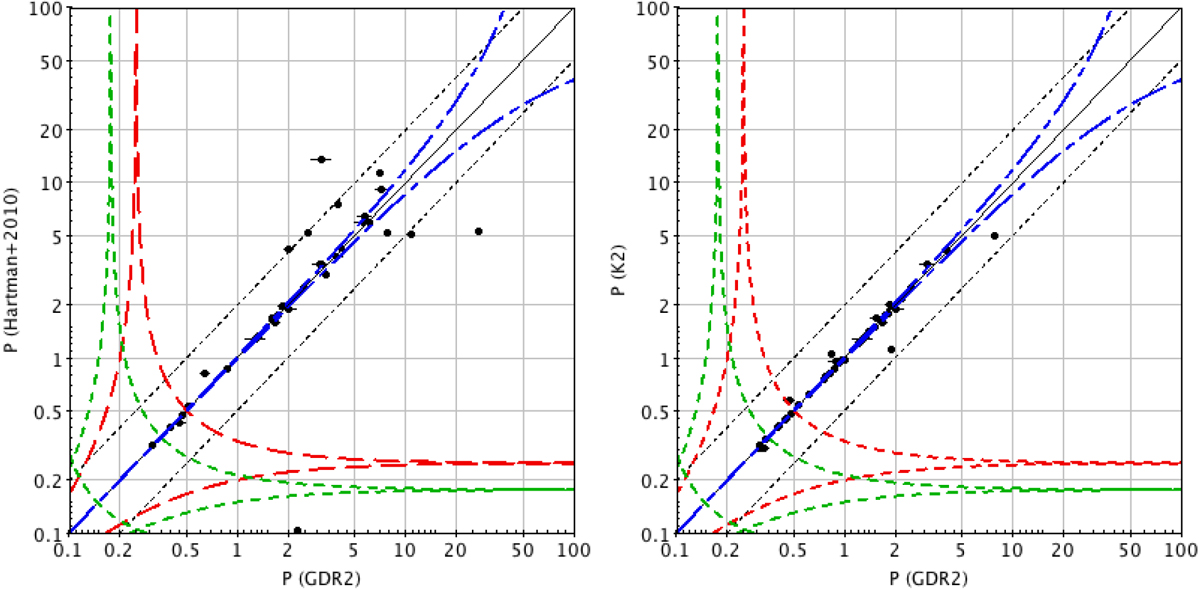
Left panel: Period comparison with the Hartman et al. (2010) Pleiades data. Black short dashed lines are the half and double period loci, red long dashed lines show the spacecraft rotation alias loci, blue dot-dashed represent the alias loci associated with Gaia spin axis precession, and green short dashed lines show the alias associated with the time delay between the two FoV (basic angle). Right panel: Period comparison with the K2 observations of the Pleiades (Rebull et al. 2016). P is given in day units.
Current usage metrics show cumulative count of Article Views (full-text article views including HTML views, PDF and ePub downloads, according to the available data) and Abstracts Views on Vision4Press platform.
Data correspond to usage on the plateform after 2015. The current usage metrics is available 48-96 hours after online publication and is updated daily on week days.
Initial download of the metrics may take a while.