Fig. 5
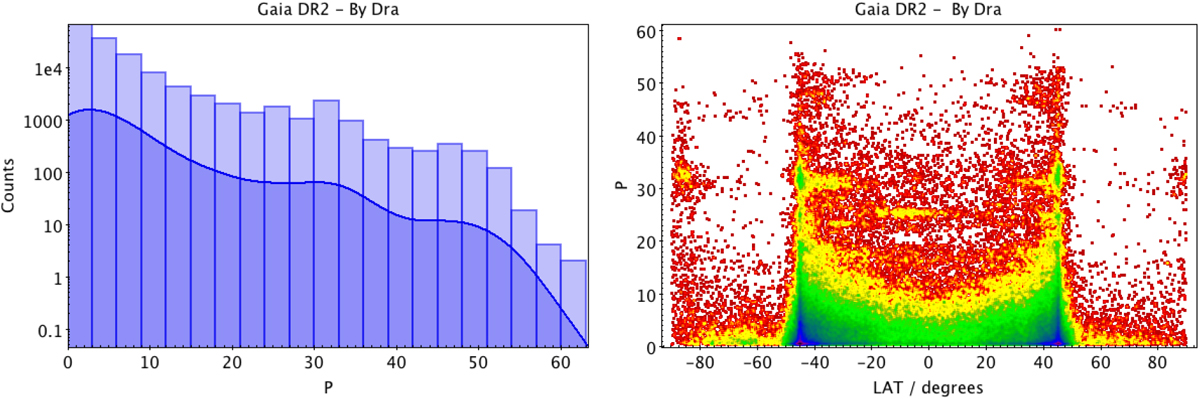
Rotation period distribution of Gaia DR2 data for BY Dra stars (P is given in day units). A 3 d binning P histogram is shown in the left panel, together with the Gaussian kernel density estimate with a 3 d width and 3-sigma truncation. The P – ecliptic latitude scatter plot (right panel) shows the higher number of period measurements at ± 45° ecliptic latitudes, particularly regarding longer periods. The colour code (rainbow) is an indication of the relative density of data points (red for lower density, and blue for higher density). Both panels give an indication of the moderate degree of aliasing, the most evident being at ≈23.5, 25.3, and 31.6 d.
Current usage metrics show cumulative count of Article Views (full-text article views including HTML views, PDF and ePub downloads, according to the available data) and Abstracts Views on Vision4Press platform.
Data correspond to usage on the plateform after 2015. The current usage metrics is available 48-96 hours after online publication and is updated daily on week days.
Initial download of the metrics may take a while.