Free Access
Fig. A.2
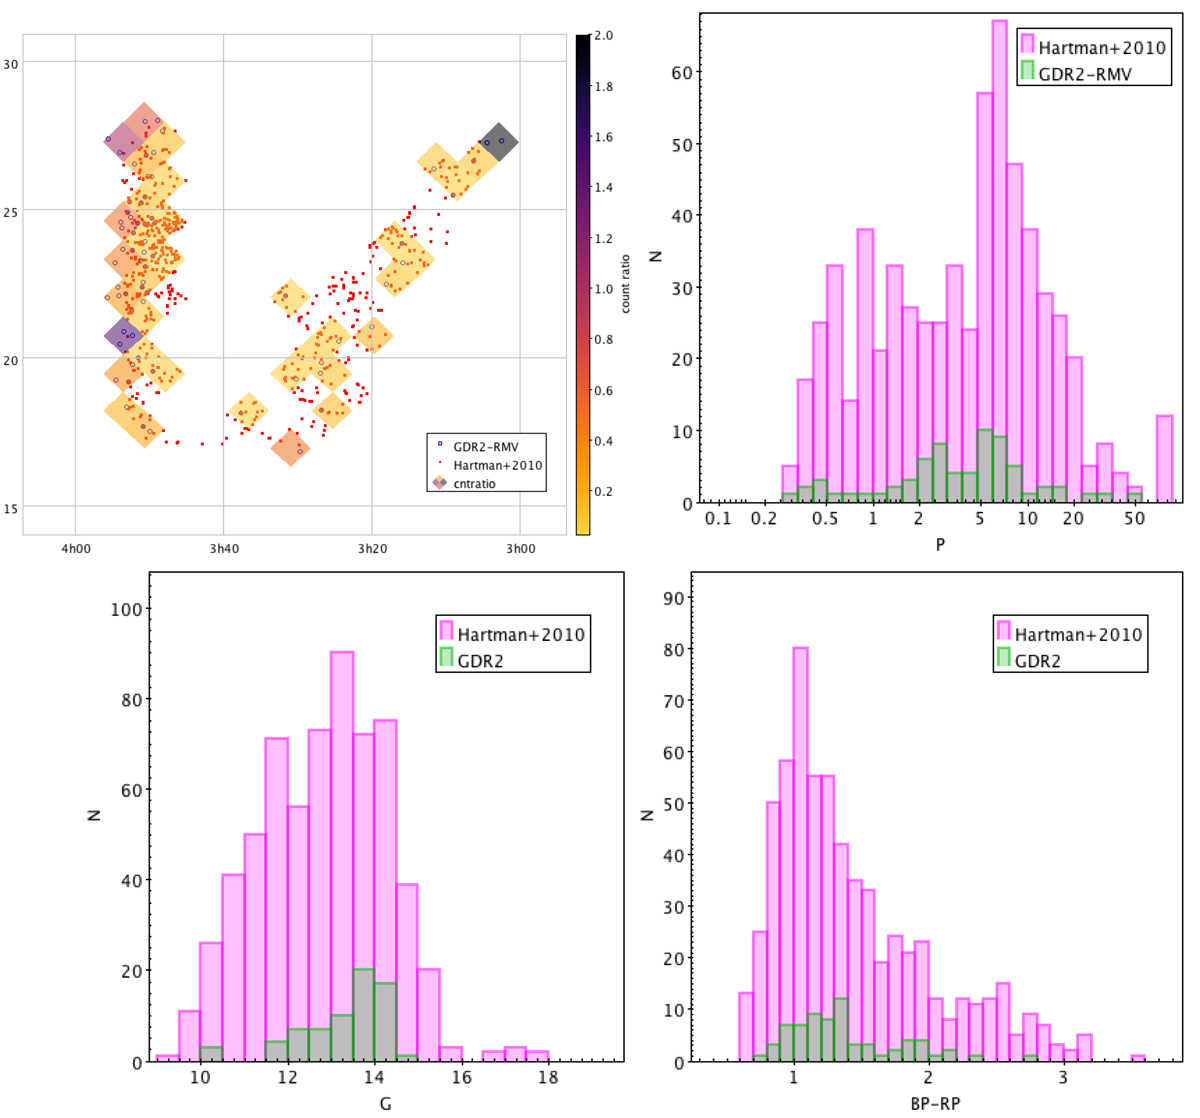
Comparison of the P, G, and BP − RP distributions between the Gaia DR2 BY Dra and the Hartman et al. (2010) samples in the overlapping HEALPix and in common P, G, and BP − RP ranges. P is given in day units.
Current usage metrics show cumulative count of Article Views (full-text article views including HTML views, PDF and ePub downloads, according to the available data) and Abstracts Views on Vision4Press platform.
Data correspond to usage on the plateform after 2015. The current usage metrics is available 48-96 hours after online publication and is updated daily on week days.
Initial download of the metrics may take a while.