Fig. A.1
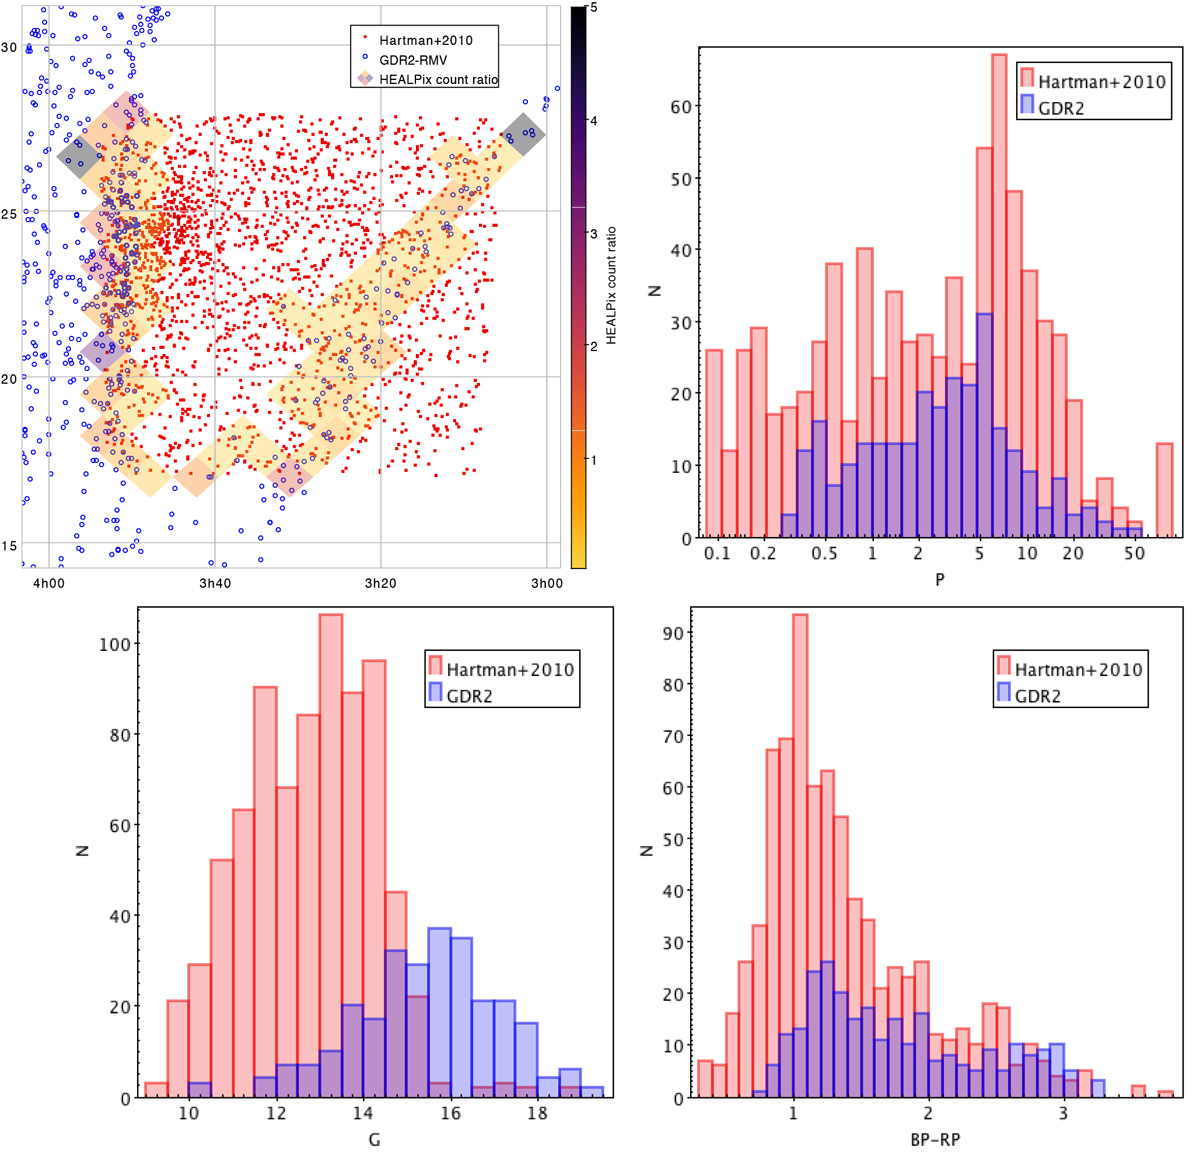
Upper left panel: sky map of the Hartman et al. (2010) sample (red filled dots) with the Gaia rotational modulation variable sample (blue open dots) overlapped. The HEALPix in which we have stars from both samples are outlined, and the colour code indicates the starnumber ratio in each HEALPix. Upper right and bottom panels: Comparison of the P, G, and (GBP − GRP) distributions in Gaia and the Hartman et al. (2010) sample in the overlapping HEALPix. P is given in day units.
Current usage metrics show cumulative count of Article Views (full-text article views including HTML views, PDF and ePub downloads, according to the available data) and Abstracts Views on Vision4Press platform.
Data correspond to usage on the plateform after 2015. The current usage metrics is available 48-96 hours after online publication and is updated daily on week days.
Initial download of the metrics may take a while.