Fig. 1
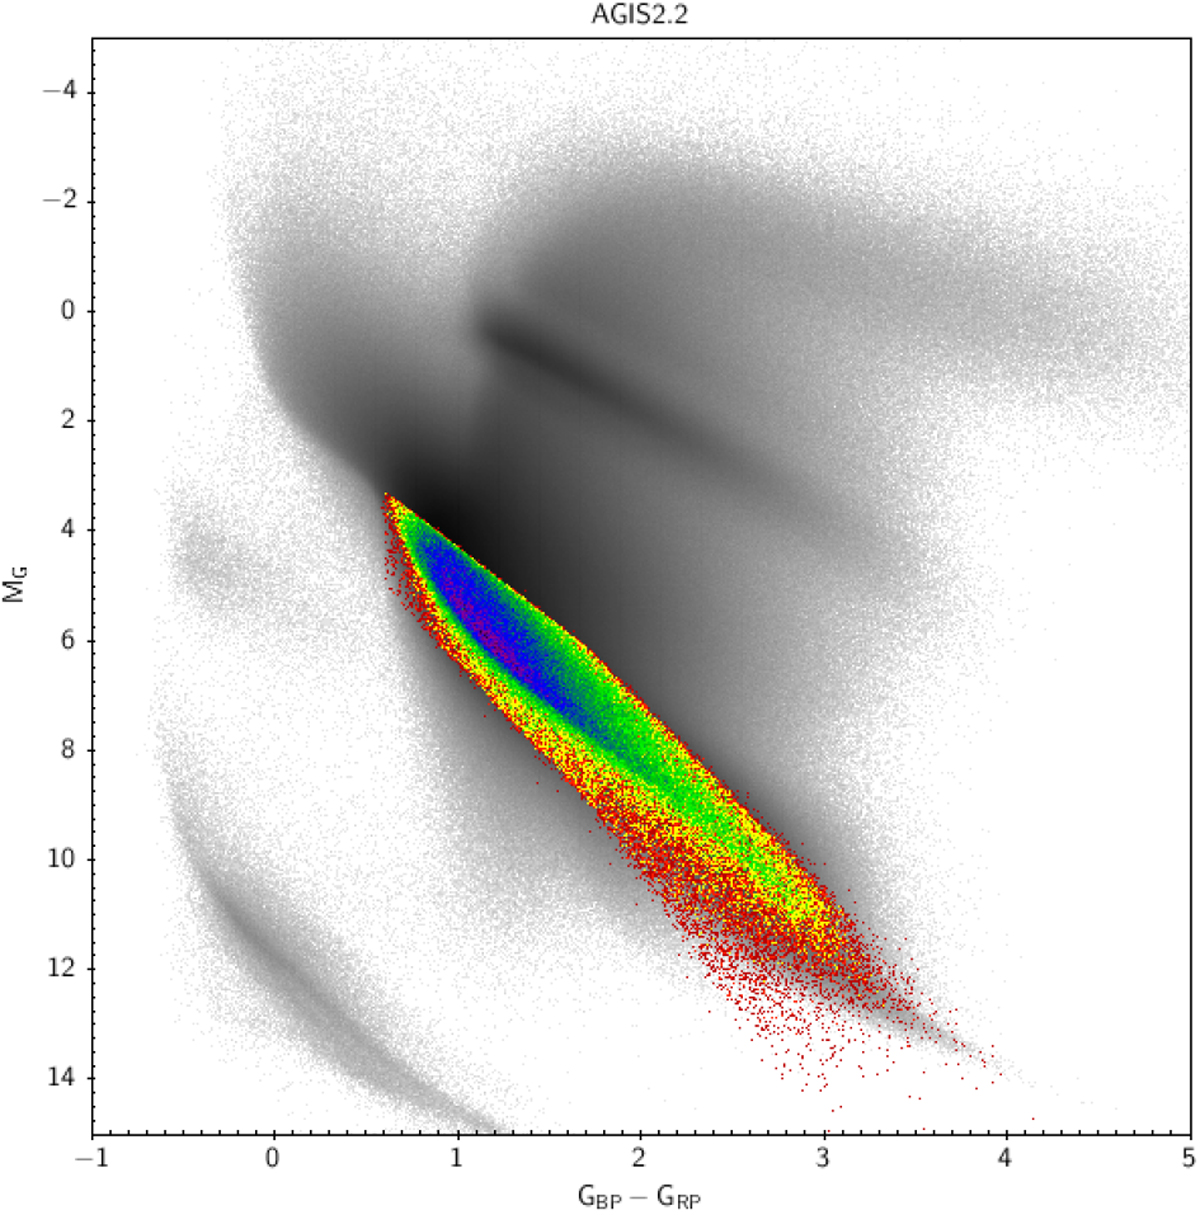
Region of the HRD in which rotational modulation was found. The region is highlighted with colours (rainbow). The colour code indicates the relative density of data points (red for lower density, and purple for higher density). The HRD shown is built using the AGIS02.2 solution for the parallax (left panel, see Lindegren et al. 2018, for details) uncorrected for interstellar extinction.
Current usage metrics show cumulative count of Article Views (full-text article views including HTML views, PDF and ePub downloads, according to the available data) and Abstracts Views on Vision4Press platform.
Data correspond to usage on the plateform after 2015. The current usage metrics is available 48-96 hours after online publication and is updated daily on week days.
Initial download of the metrics may take a while.