Fig. 6.
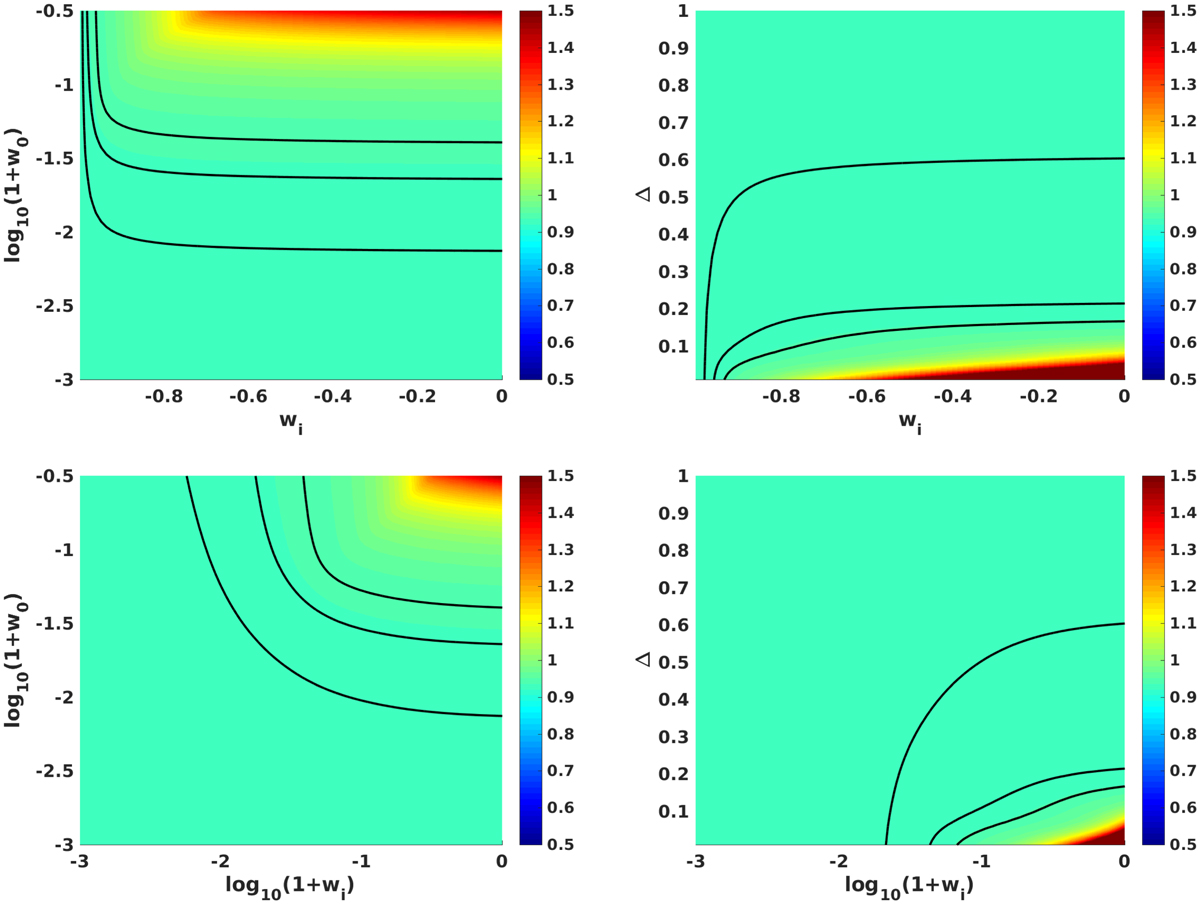
Constraints in the (w0, wi) and (Δ, wi) planes (left and right panels, respectively) for the three-parameter Model L. The top panels correspond to a uniform prior on wi, while the bottom ones correspond to a uniform prior on log10(1 + wi). In all cases the black contours denote the one, two and three-sigma confidence levels, while the colourmap depicts the reduced chi-square of the fit for each set of model parameters (dark red corresponds to a reduced chi-square of 1.5 or larger).
Current usage metrics show cumulative count of Article Views (full-text article views including HTML views, PDF and ePub downloads, according to the available data) and Abstracts Views on Vision4Press platform.
Data correspond to usage on the plateform after 2015. The current usage metrics is available 48-96 hours after online publication and is updated daily on week days.
Initial download of the metrics may take a while.