Fig. 2.
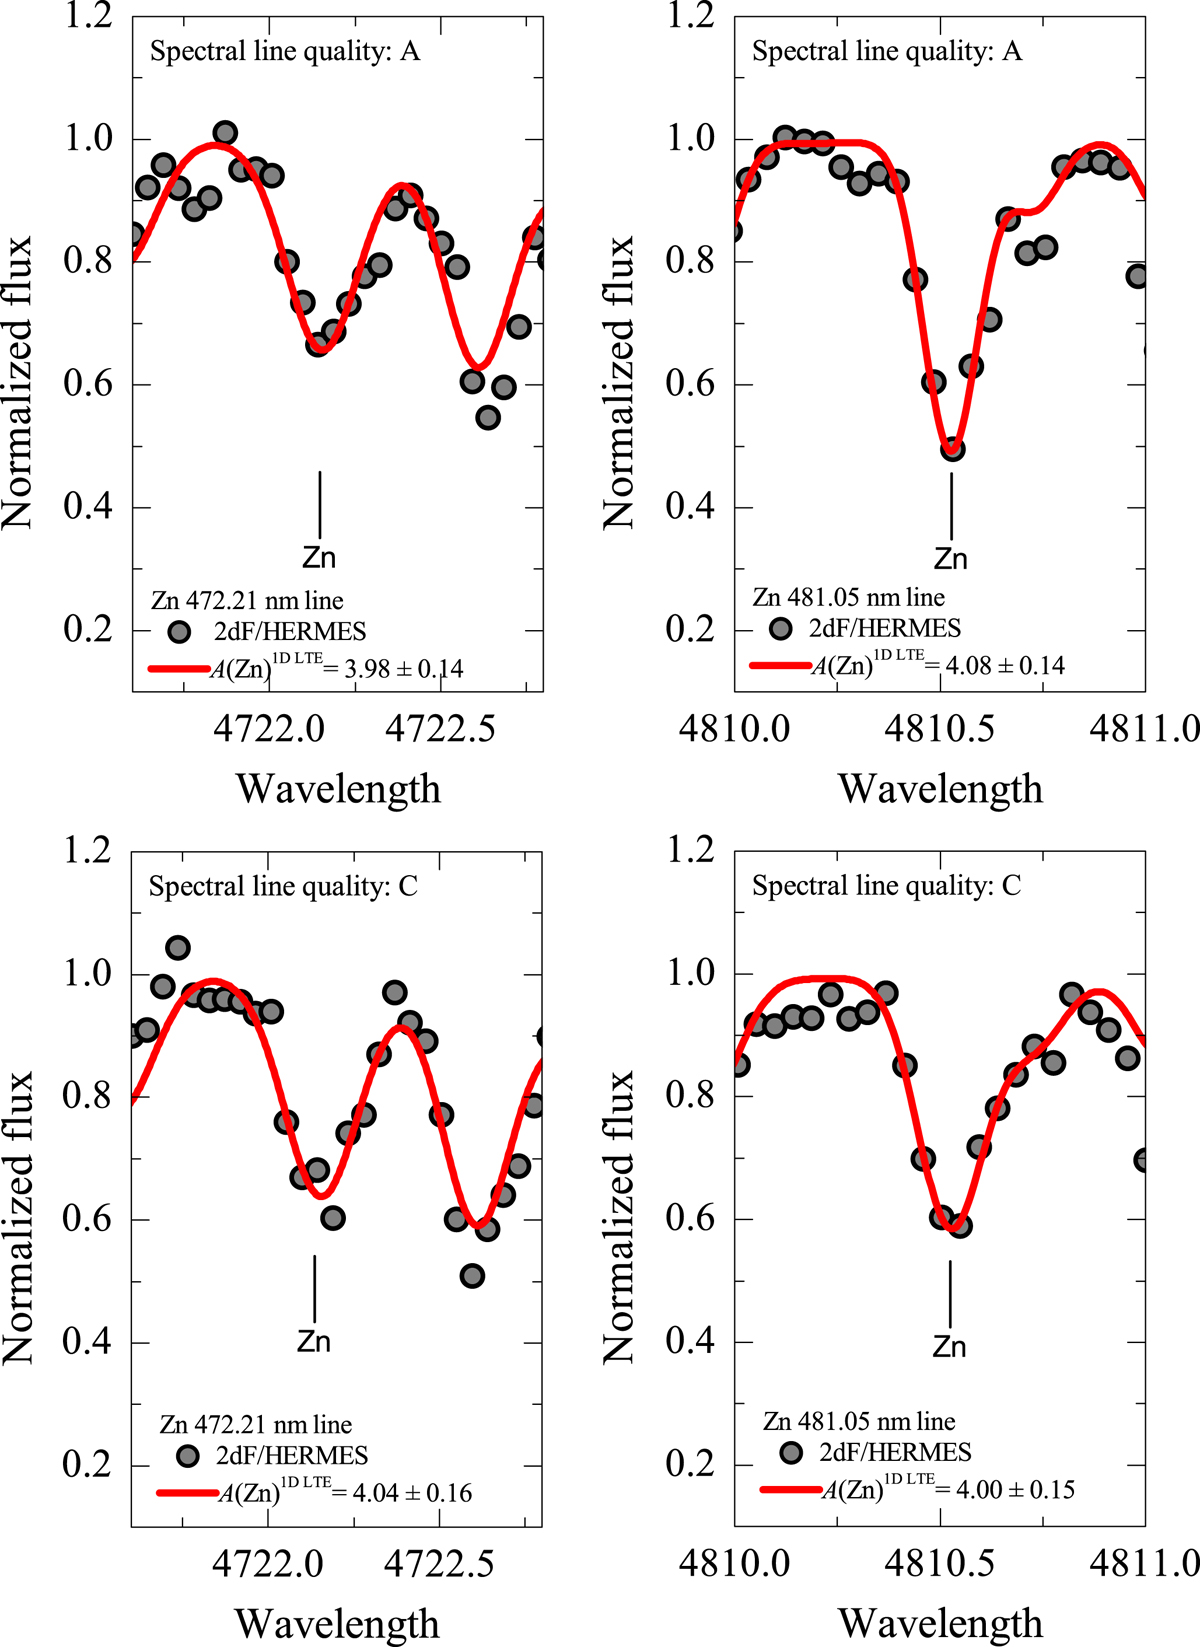
Typical fits of synthetic spectra (red solid lines) to the observed Zn I line profiles (marked by vertical ticks) in the 2dF/HERMES spectra (filled gray circles) of the target RGB stars S1800 (top row; Teff = 4510 K, log g = 1.90) and S167 (bottom row; Teff = 4390 K, log g = 1.60). We also indicate zinc abundances A(Zn) determined from each spectral line, together with their errors (Sect. 2.2). The quality class of the Zn I line is indicated at the top of each panel (see Sect. 2.2 for the line class definition).
Current usage metrics show cumulative count of Article Views (full-text article views including HTML views, PDF and ePub downloads, according to the available data) and Abstracts Views on Vision4Press platform.
Data correspond to usage on the plateform after 2015. The current usage metrics is available 48-96 hours after online publication and is updated daily on week days.
Initial download of the metrics may take a while.