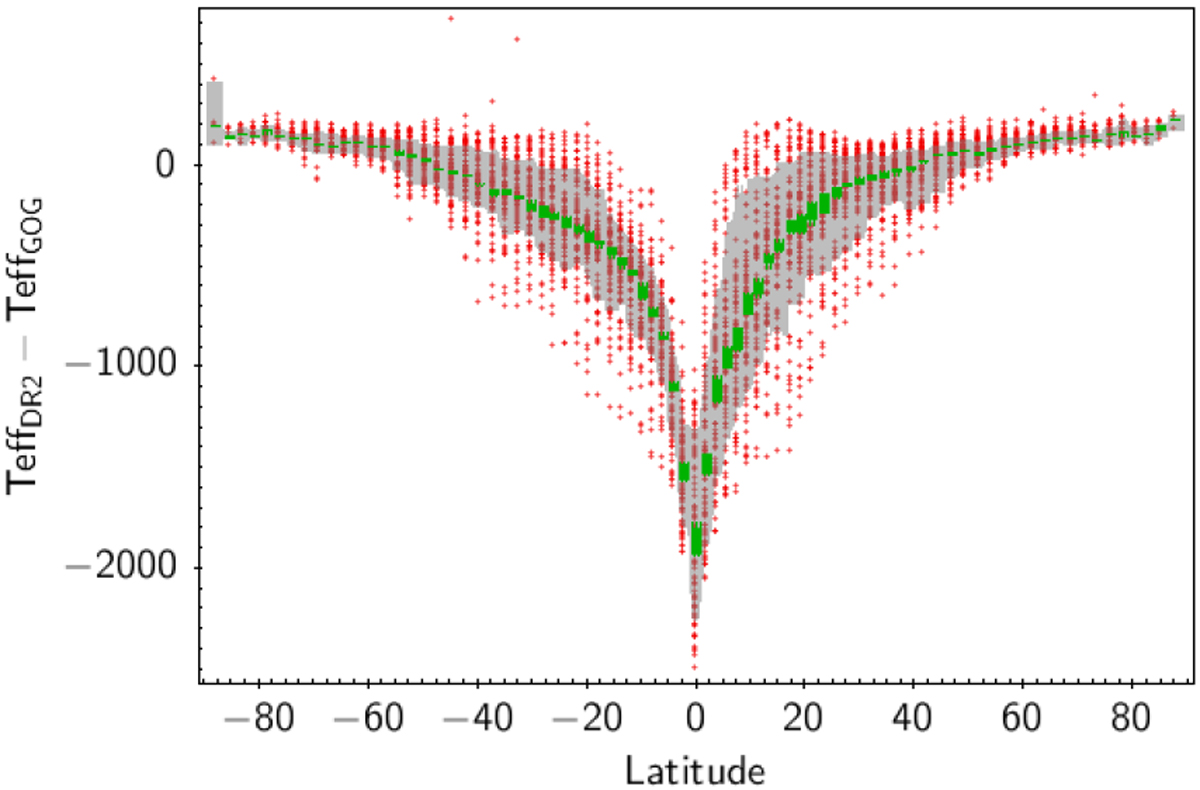
Fig. 43

Difference of the mean Teff (K) between Gaia DR2 data and GOG simulation. Each red dot corresponds to the mean difference in a healpix bin at a given latitude (abscissa, in degrees) limited to the magnitude range 16 < G < 17. The grey area indicates the Q = 0.15 to 0.85 distribution quantiles and the green one the central values (Q = 0.46 to 0.54).
Current usage metrics show cumulative count of Article Views (full-text article views including HTML views, PDF and ePub downloads, according to the available data) and Abstracts Views on Vision4Press platform.
Data correspond to usage on the plateform after 2015. The current usage metrics is available 48-96 hours after online publication and is updated daily on week days.
Initial download of the metrics may take a while.


