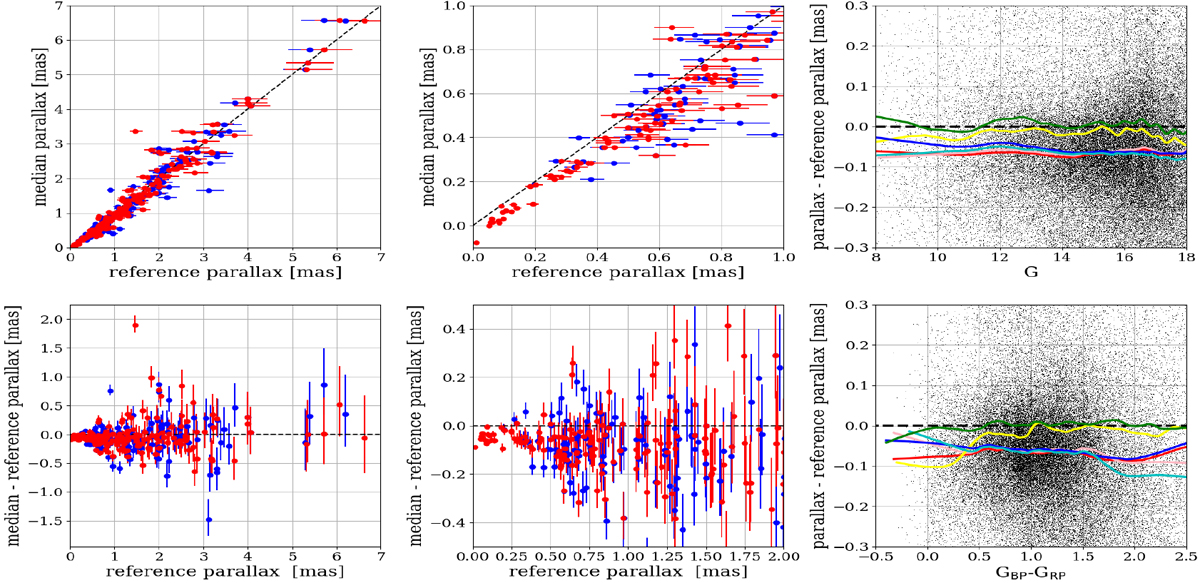
Fig. 16

Parallax comparisons with clusters using the MWSC and DAML catalogues. Upper left panel: cluster median DR2 parallaxes compared with literature: MWSC (red dots) and DAML (blue dots). Upper central panel: same as left panel, restricted to ϖ < 1 mas. Upper right panel: parallax differences for the cluster star sample as a function of G (black dots). Lower left panel: parallax differences for the whole sample. Lower central panel: same as left panel, for ϖ < 2 mas. The right panels are analogous for the whole star sample (black dots). Lower right panel: parallax differences as a function of the colour (GBP − GRP). In the right panels, lines show the smoothing for the two reference catalogues for different distances. The red line indicates the whole MWSC, the pink line shows MWSC OCs with a distance d > 1000 pc, the yellow line represents MWSC OCs with d < 500 pc, the blue line shows all OCs in DAML, the cyan line shows DAML with d > 1000 pc, and the green line represents DAML with d < 500 pc.
Current usage metrics show cumulative count of Article Views (full-text article views including HTML views, PDF and ePub downloads, according to the available data) and Abstracts Views on Vision4Press platform.
Data correspond to usage on the plateform after 2015. The current usage metrics is available 48-96 hours after online publication and is updated daily on week days.
Initial download of the metrics may take a while.


