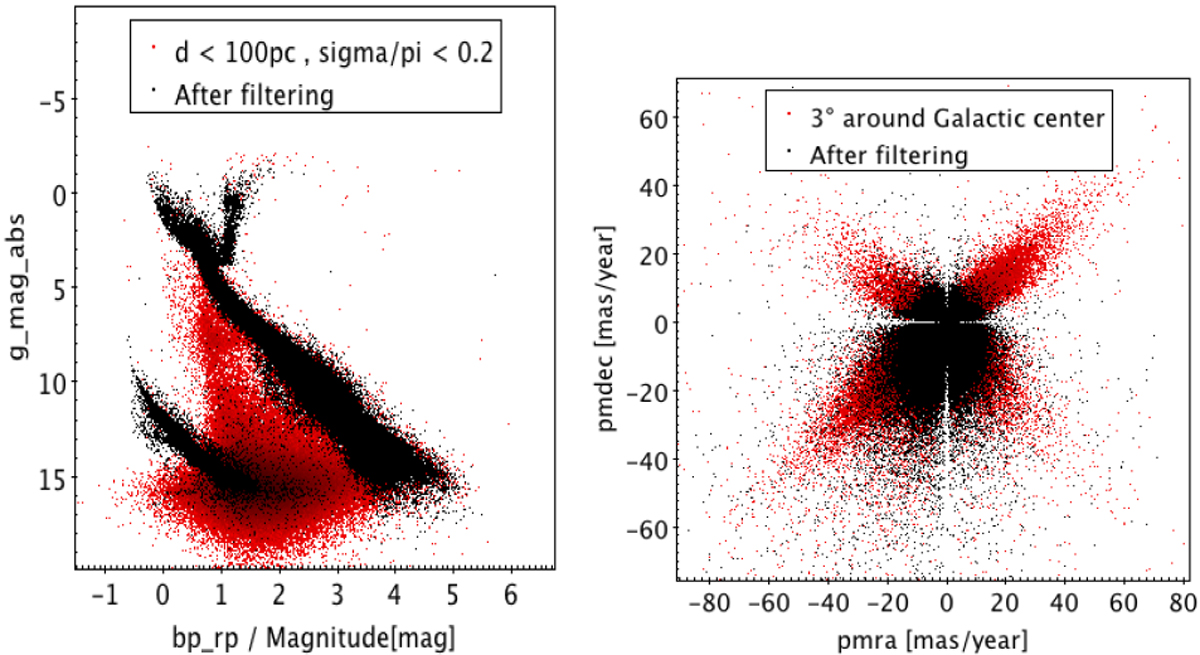
Fig. 11

HR diagram of stars closer than 100 pc (left panel) and proper motion diagram near the Galactic centre (right panel), with (black) or without (red) filtering of spurious solutions with Eqs. (1) and (2). In both cases, a 20% relative uncertainty limit on the astrometric parameters has also been applied (which generates a “void cross” at the origin on the right).
Current usage metrics show cumulative count of Article Views (full-text article views including HTML views, PDF and ePub downloads, according to the available data) and Abstracts Views on Vision4Press platform.
Data correspond to usage on the plateform after 2015. The current usage metrics is available 48-96 hours after online publication and is updated daily on week days.
Initial download of the metrics may take a while.


