Fig. 8.
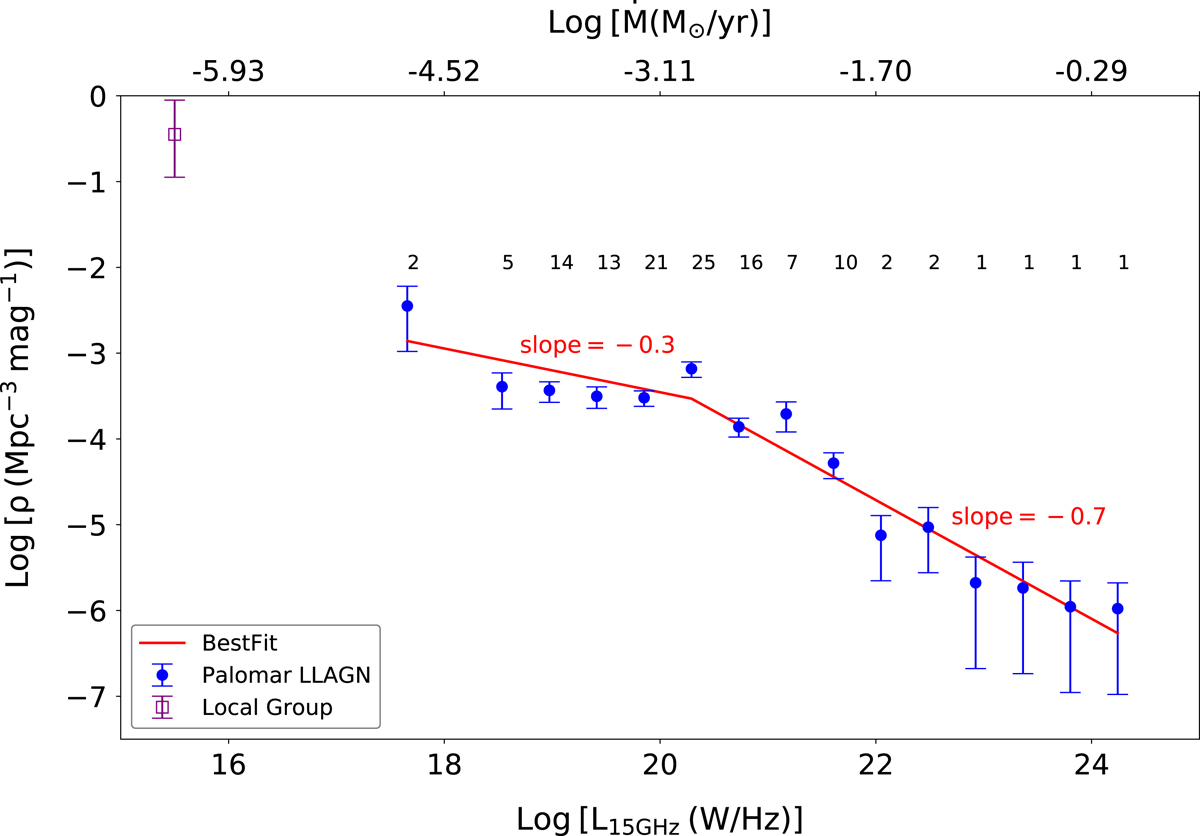
Radio luminosity function of the LLAGN in the Palomar sample. For each bin, the number of galaxies is shown at the top. Error-bars are assigned assuming Poisson statistics. For a rough comparison, we also plot the estimated position for galaxies in the local group (from Nagar et al. 2005, shown in open square) in the 15 GHz nuclear RLF. The red line is the best-fit broken power law to the RLF. It has a slope of ∼−0.7 at the brightest end (complete sample, excluding the five lowest radio luminosity points), and ∼−0.3 for the fainter sources. The upper x-axis shows the implied logarithmic values of the mass accretion rate (in M⊙ yr−1) within the context of a jet model, assuming a 10% energy conversion efficiency (see Sect. 6.1 for details).
Current usage metrics show cumulative count of Article Views (full-text article views including HTML views, PDF and ePub downloads, according to the available data) and Abstracts Views on Vision4Press platform.
Data correspond to usage on the plateform after 2015. The current usage metrics is available 48-96 hours after online publication and is updated daily on week days.
Initial download of the metrics may take a while.