Fig. 6.
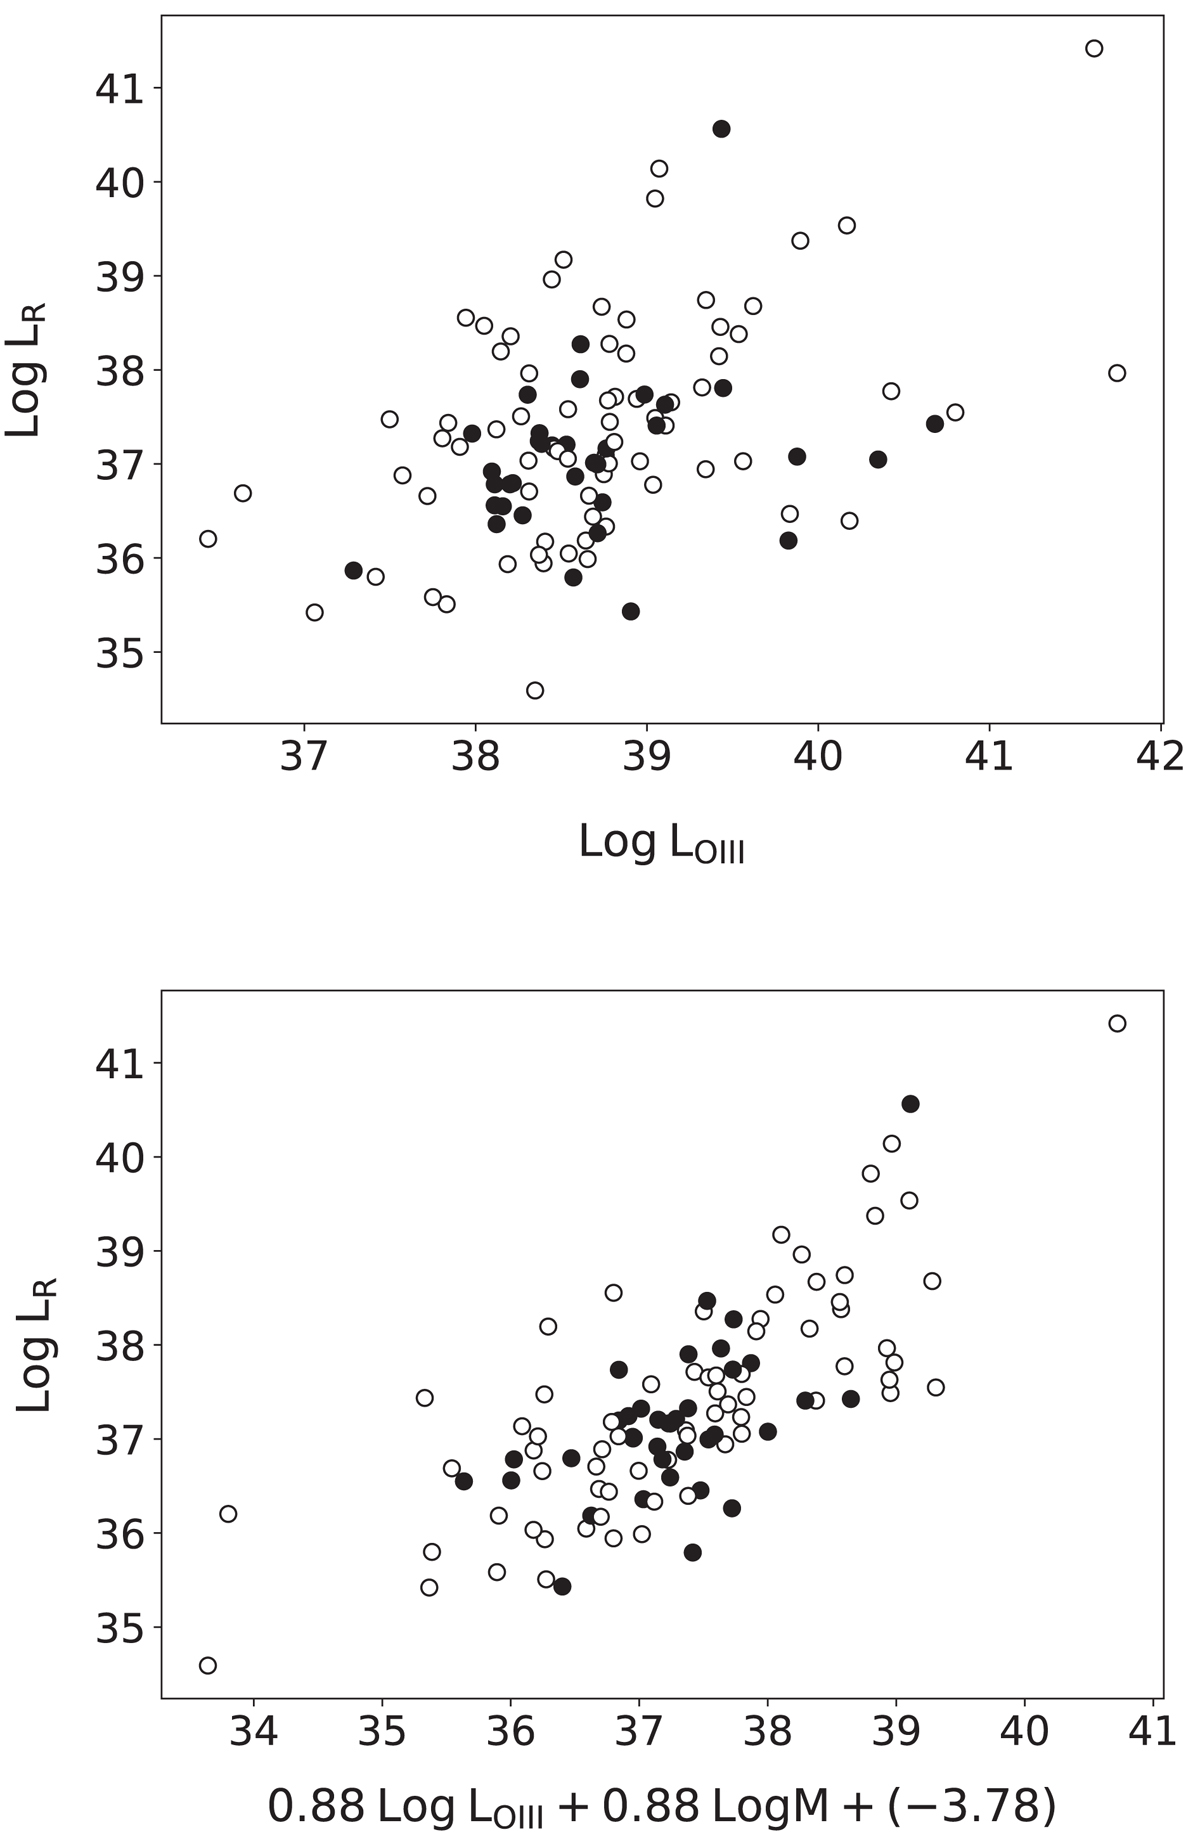
Top panel: radio luminosity obtained with the VLA at 15 GHz and the nuclear [OIII] emission line luminosity (Pearson correlation coefficient = 0.43, p-value = 2.6 × 10⁻⁶). Bottom panel: tighter correlation after including the mass of the black hole as the third parameter. This is the edge-on view of the optical fundamental plane obtained by using only the LLAGN sample (Pearson correlation coefficient = 0.74, p-value = 4.2 × 10⁻²⁰). While the new detections reported in this paper are shown with filled circles, the old detections are depicted by open circles. Luminosities are given in erg s−1 while the masses are in units of solar mass.
Current usage metrics show cumulative count of Article Views (full-text article views including HTML views, PDF and ePub downloads, according to the available data) and Abstracts Views on Vision4Press platform.
Data correspond to usage on the plateform after 2015. The current usage metrics is available 48-96 hours after online publication and is updated daily on week days.
Initial download of the metrics may take a while.