Free Access
Fig. 3.
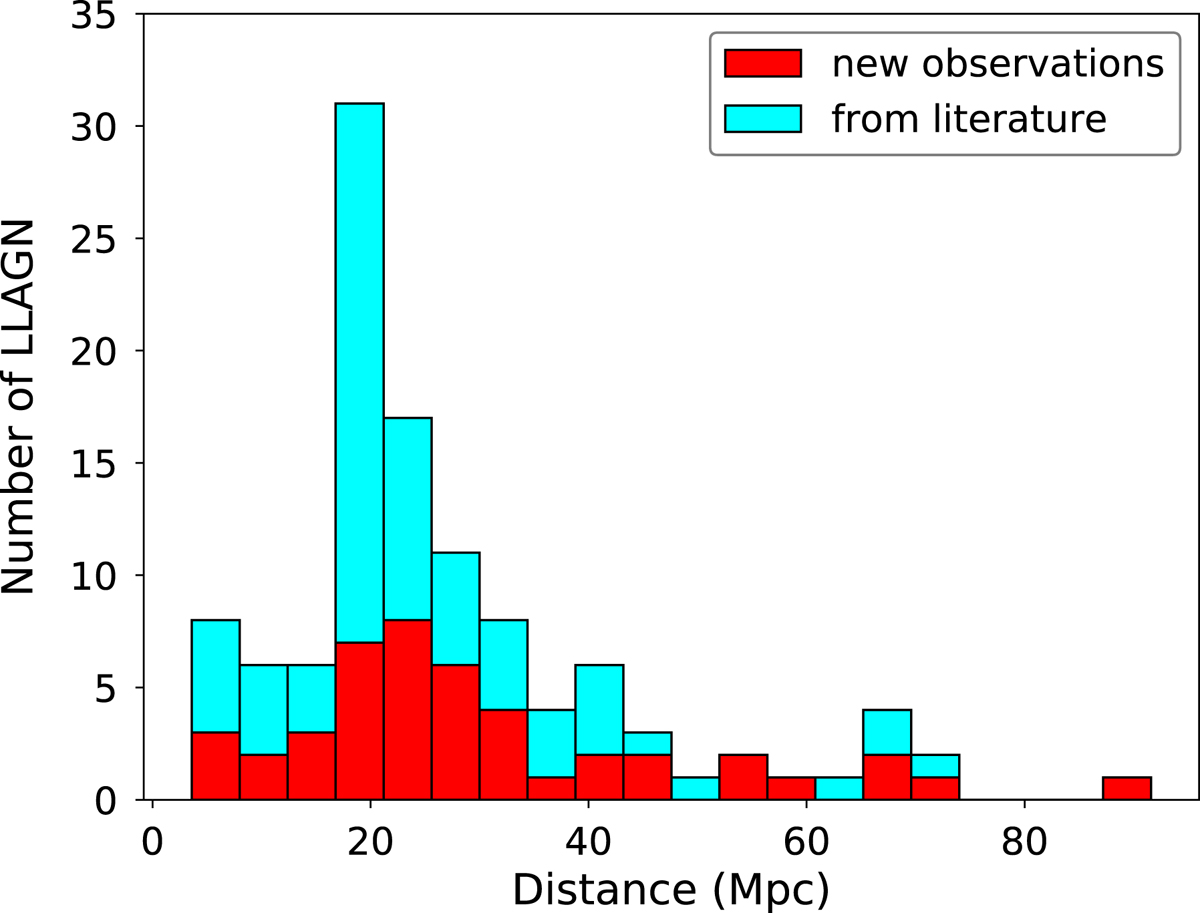
Histograms of the distances for the sample of galaxies observed in this paper (red) and detected by previous studies in the literature (cyan). The peak in the histogram around D ∼ 17 Mpc is caused by the members of the Virgo cluster.
Current usage metrics show cumulative count of Article Views (full-text article views including HTML views, PDF and ePub downloads, according to the available data) and Abstracts Views on Vision4Press platform.
Data correspond to usage on the plateform after 2015. The current usage metrics is available 48-96 hours after online publication and is updated daily on week days.
Initial download of the metrics may take a while.