Fig. 1.
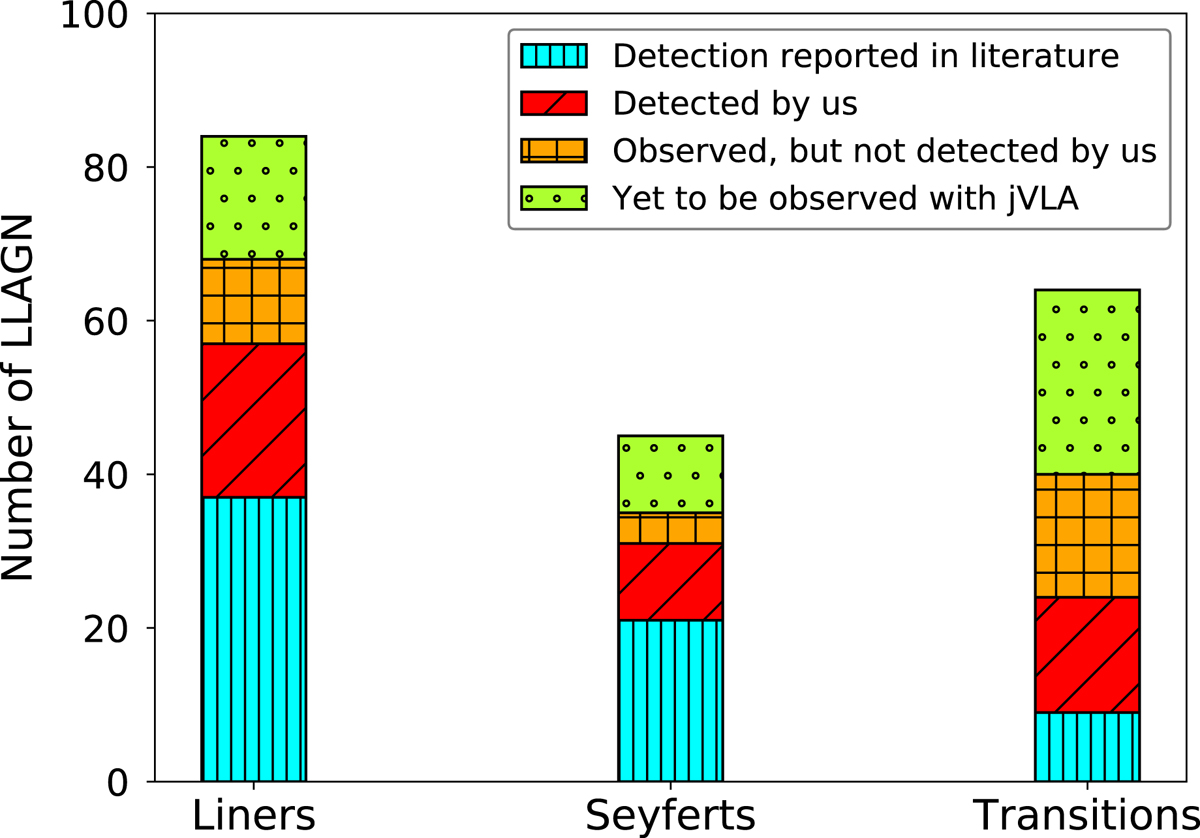
Different types of LLAGN in the Palomar Sample (197 sources, classification taken from in Ho et al. 1997). The red (filled with slanted lines) bins represent the new detections reported in this paper, while the cyan (vertical lines) bins represent the earlier observations reported in the literature (compiled in Nagar et al. 2005). The orange (crossed lines) bins depict the number of galaxies that were observed by us but not detected. Finally, the dotted region in green shows the number of galaxies yet to be observed with the highly sensitive VLA.
Current usage metrics show cumulative count of Article Views (full-text article views including HTML views, PDF and ePub downloads, according to the available data) and Abstracts Views on Vision4Press platform.
Data correspond to usage on the plateform after 2015. The current usage metrics is available 48-96 hours after online publication and is updated daily on week days.
Initial download of the metrics may take a while.