Fig. 10
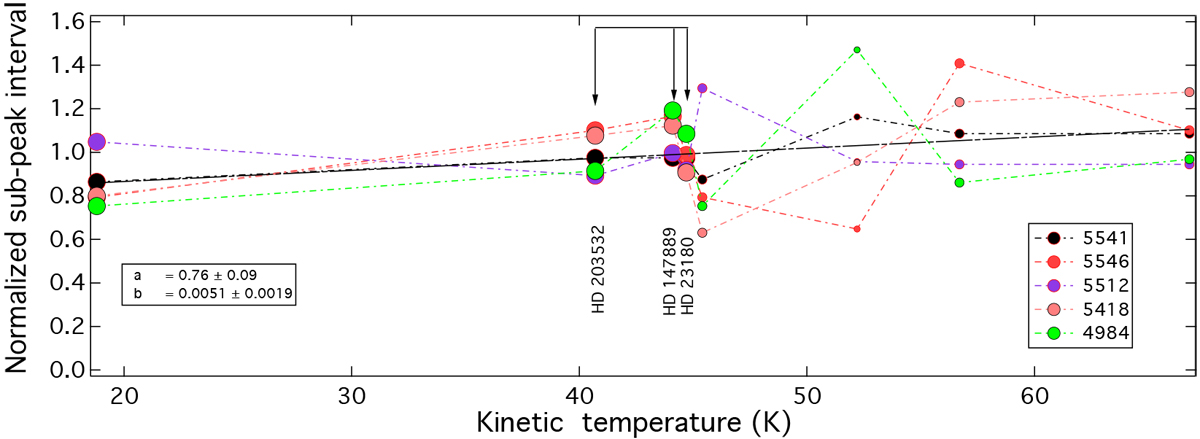
Normalized spectral intervals between the sub-peaks in the profiles of several C2 -DIBs as a functionof the C2-based kinetic temperature (see text) of each target. Uncertainties on the intervals can be deduced visually from the drawn profiles in Figs. 3–7, and are on the order of the data point dispersion. The dashed line is a linear fit to the average over the five different DIBs. The size of the marker indicates the reliability of the sub-peak interval determination, again visually determined from the quoted figures. The three targets used for the co-addition of the DIB profiles are marked by arrows.
Current usage metrics show cumulative count of Article Views (full-text article views including HTML views, PDF and ePub downloads, according to the available data) and Abstracts Views on Vision4Press platform.
Data correspond to usage on the plateform after 2015. The current usage metrics is available 48-96 hours after online publication and is updated daily on week days.
Initial download of the metrics may take a while.