Fig. 9.
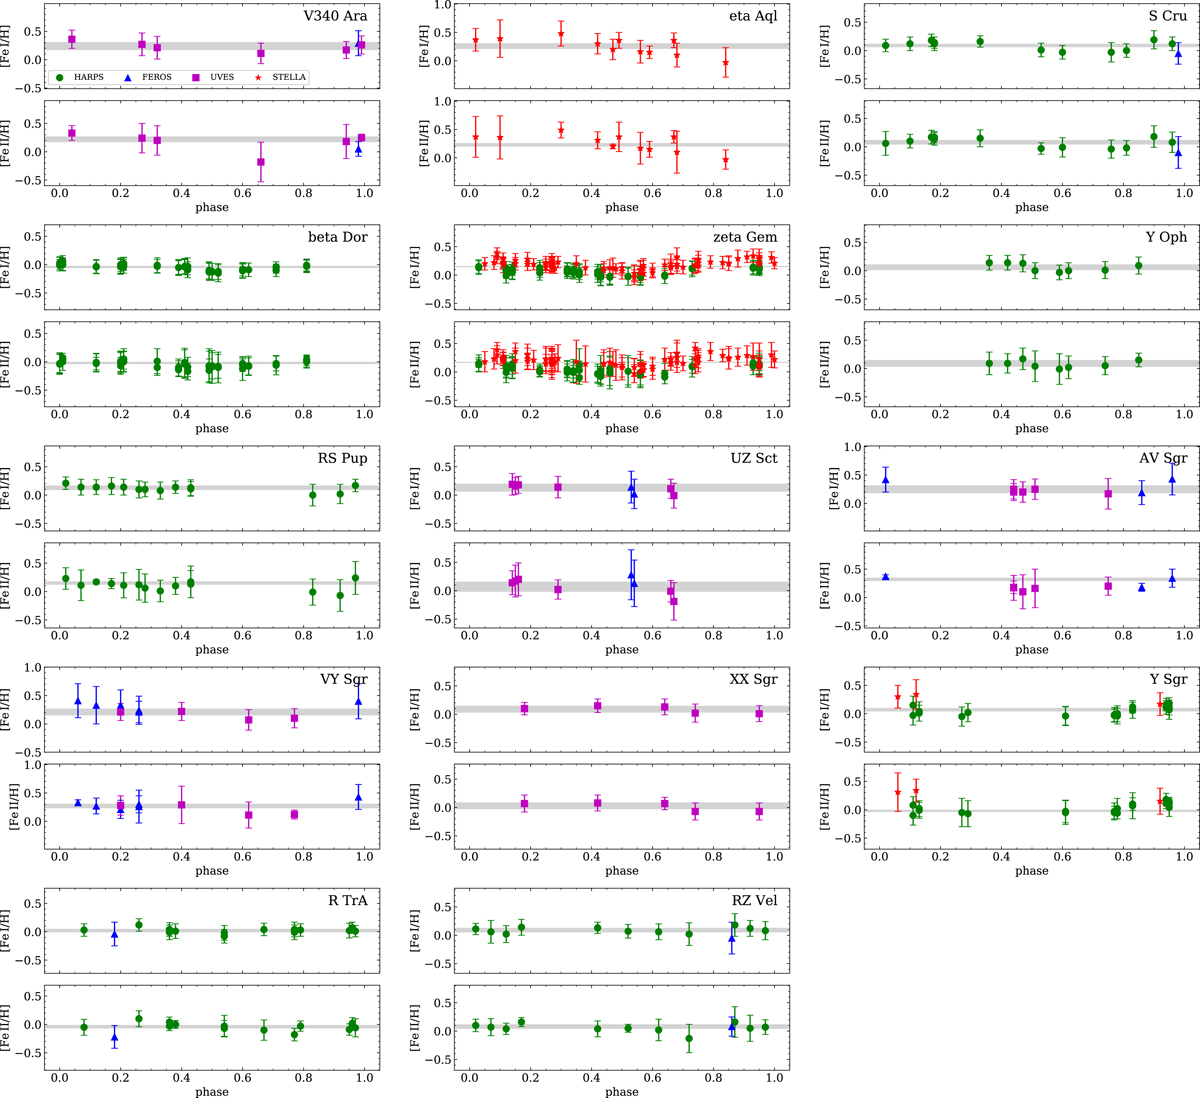
Abundances from Fe I and Fe II lines as a function of the pulsation phase. The color coding of the various points is the same as in Fig. 8. To help with the comparison, the panels are plotted with same y-axis range: 1.5 dex for both Fe i and Fe ii panels. The light gray shaded regions indicate the ±1σ uncertainty around the weighted mean (from columns 5 and 6 of Table 2).
Current usage metrics show cumulative count of Article Views (full-text article views including HTML views, PDF and ePub downloads, according to the available data) and Abstracts Views on Vision4Press platform.
Data correspond to usage on the plateform after 2015. The current usage metrics is available 48-96 hours after online publication and is updated daily on week days.
Initial download of the metrics may take a while.