Fig. 7.
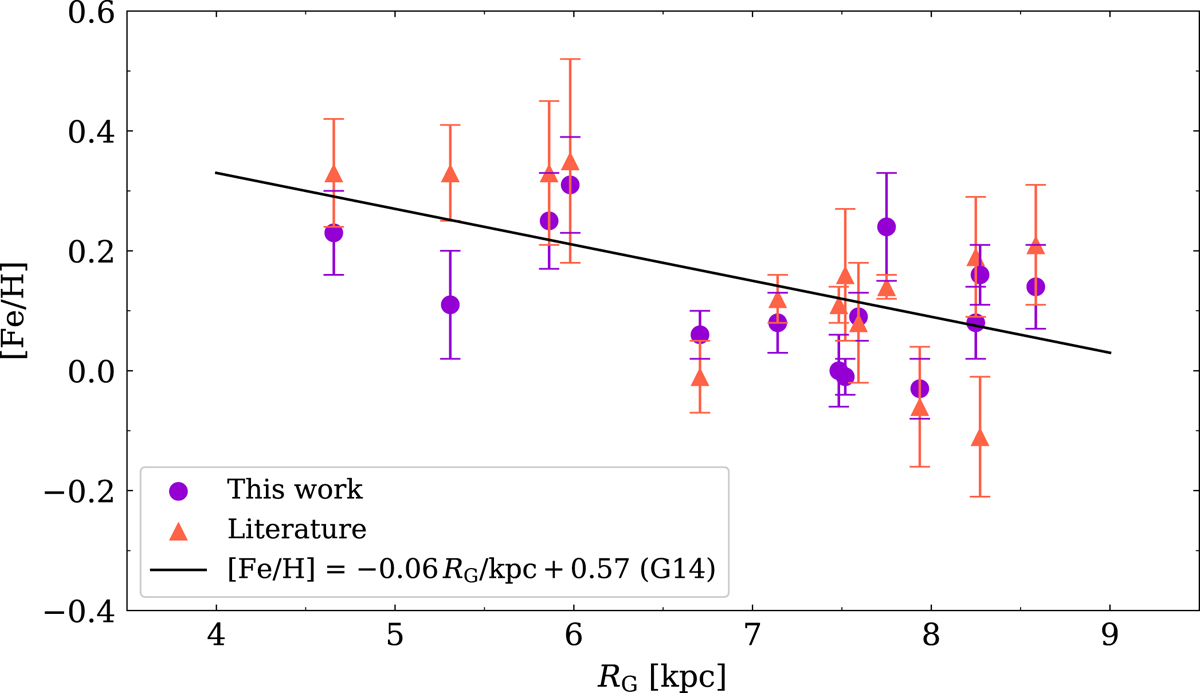
Iron abundances as a function of Galactocentric distances for the calibrating Cepheids. Values derived in the present work (Table 2) are compared with those from the literature (Table 1). The error bars on our metallicity estimates are the largest value between the uncertainty on the weighted mean and the standard deviation. The metallicity gradient derived by Genovali et al. (2014) is also shown.
Current usage metrics show cumulative count of Article Views (full-text article views including HTML views, PDF and ePub downloads, according to the available data) and Abstracts Views on Vision4Press platform.
Data correspond to usage on the plateform after 2015. The current usage metrics is available 48-96 hours after online publication and is updated daily on week days.
Initial download of the metrics may take a while.