Free Access
Fig. 8.
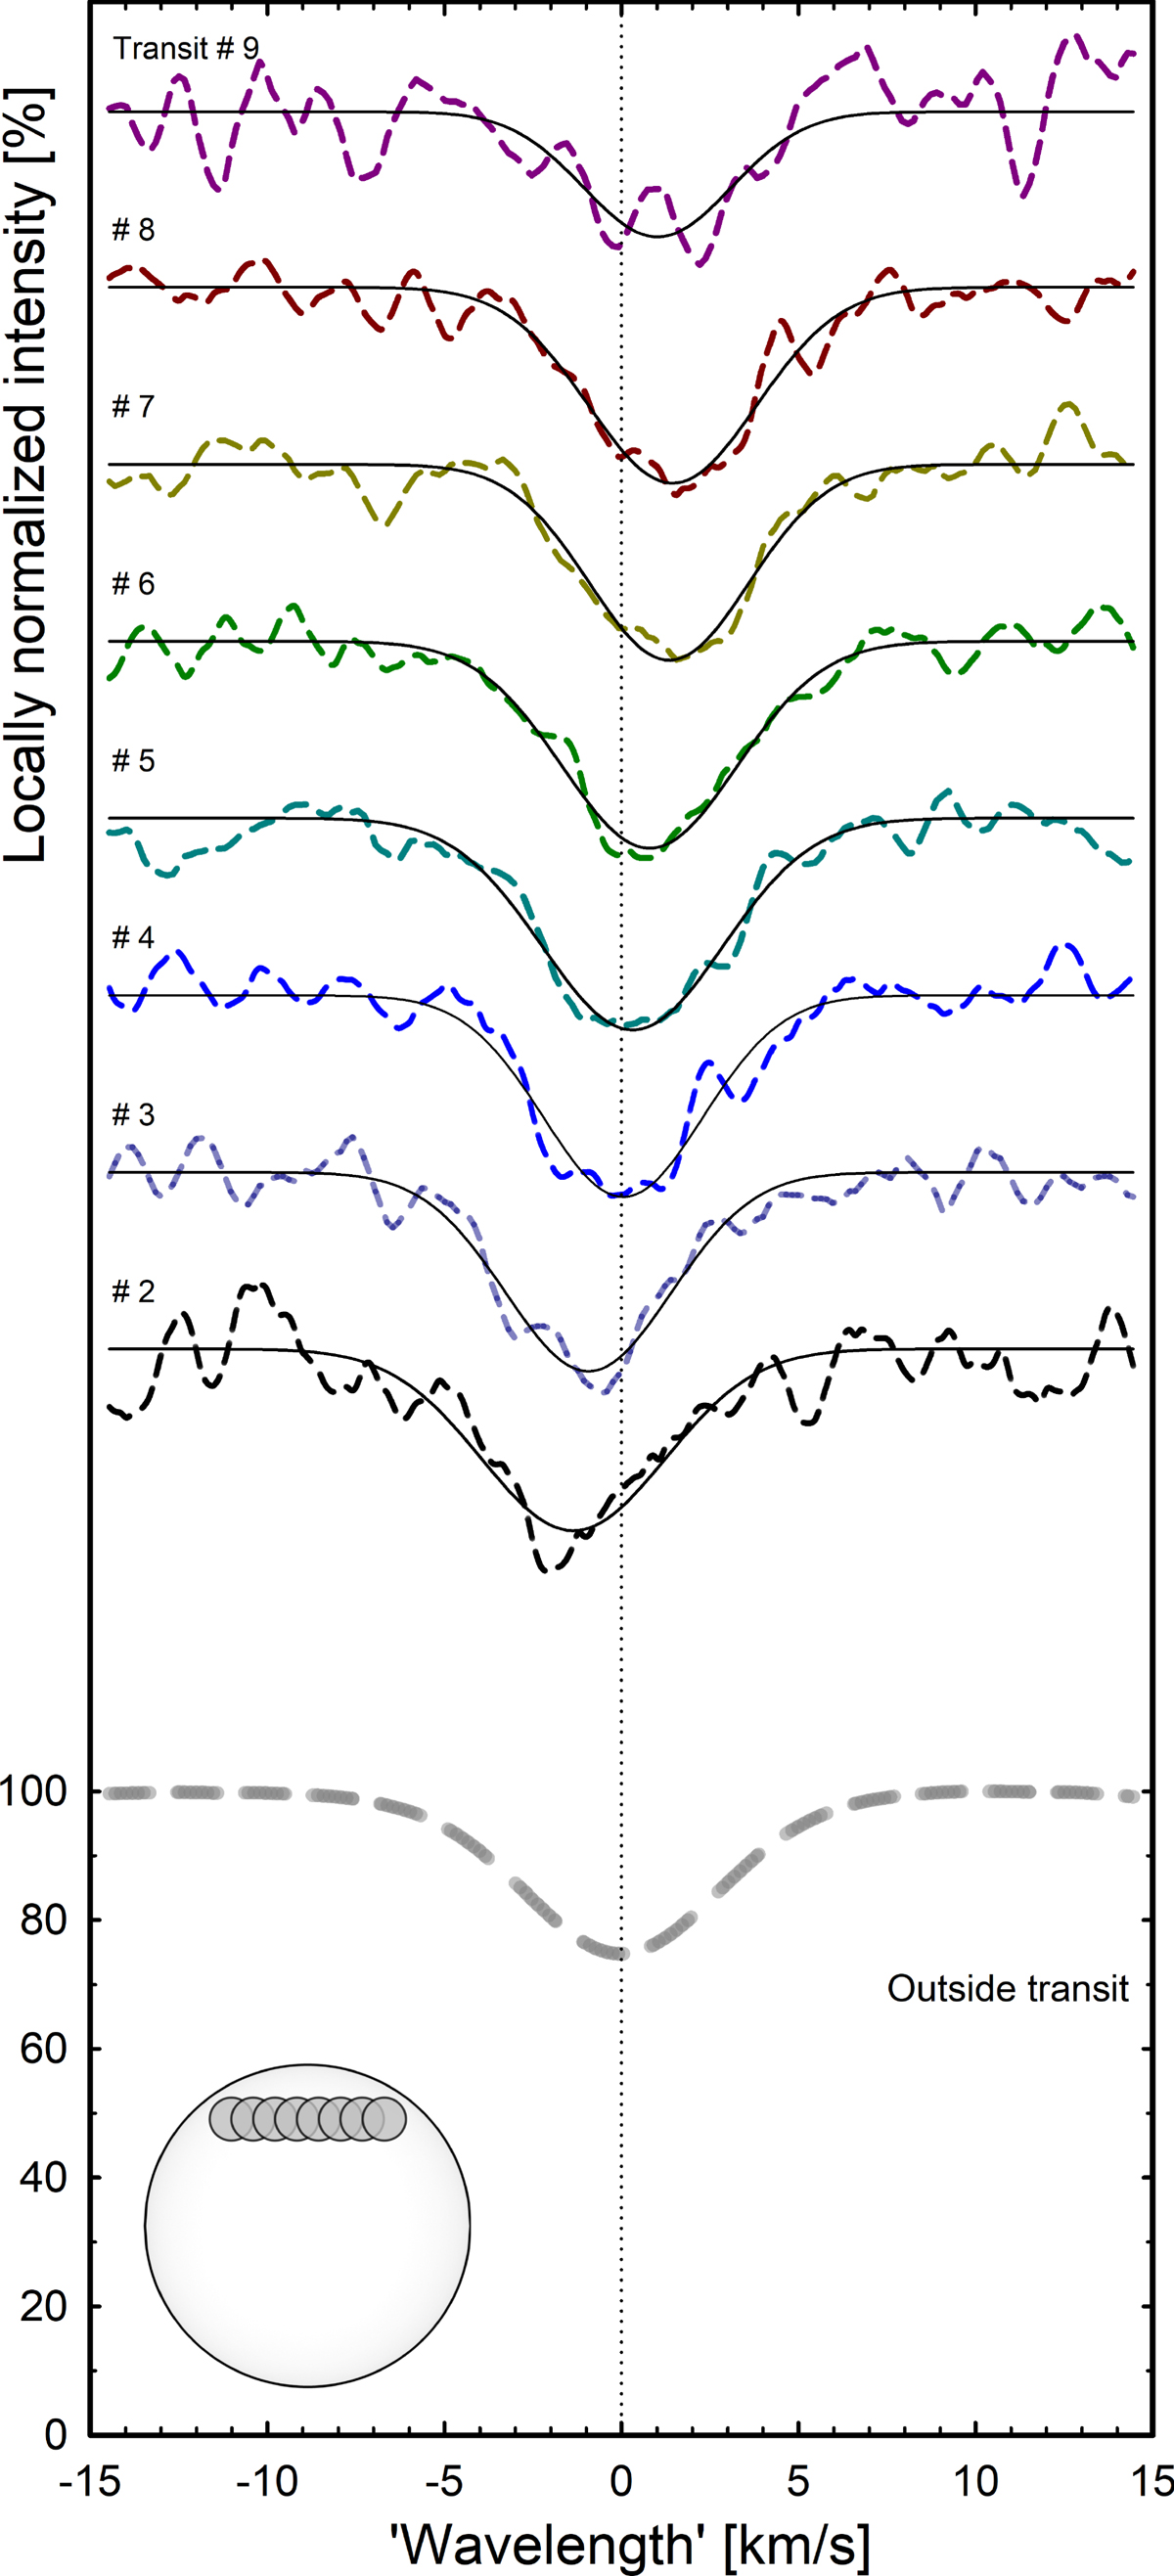
Reconstructed line profiles for the weak Fe I line at eight positions during the planetary transit, analogous to Fig. 7. Time increases from bottom up, and the planet positions for the successive transit epochs (left to right) corresponding to each line profile are to scale.
Current usage metrics show cumulative count of Article Views (full-text article views including HTML views, PDF and ePub downloads, according to the available data) and Abstracts Views on Vision4Press platform.
Data correspond to usage on the plateform after 2015. The current usage metrics is available 48-96 hours after online publication and is updated daily on week days.
Initial download of the metrics may take a while.