Free Access
Fig. 5.
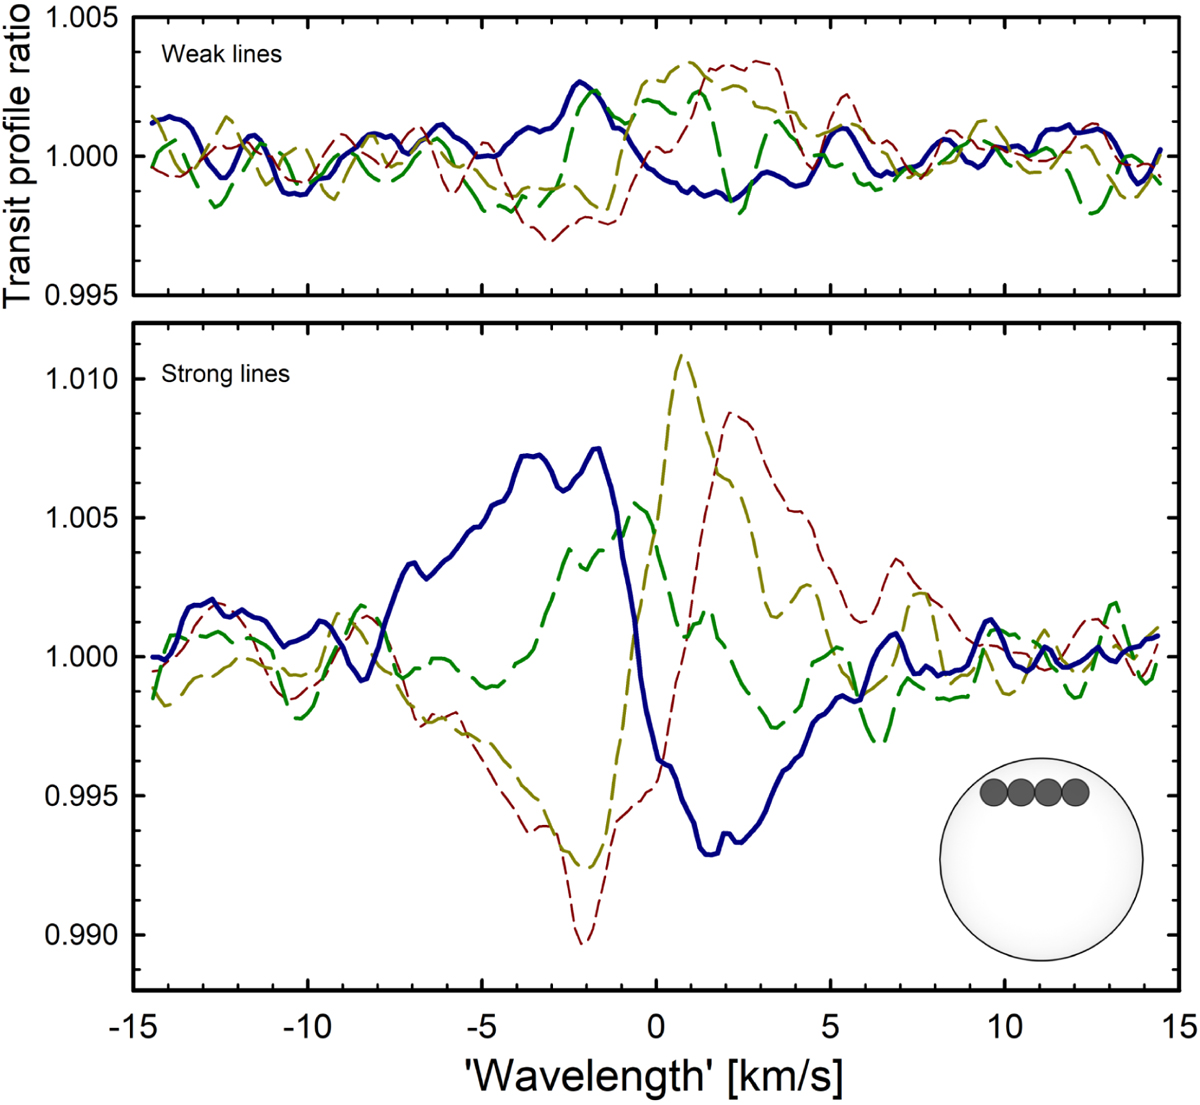
Ratios between observed weak and strong line profiles to the profile from outside transit, at four different transit epochs, indicated by planet positions to scale across the stellar disk (time increases left to right). Data for successively later times are plotted with successively shorter dashes.
Current usage metrics show cumulative count of Article Views (full-text article views including HTML views, PDF and ePub downloads, according to the available data) and Abstracts Views on Vision4Press platform.
Data correspond to usage on the plateform after 2015. The current usage metrics is available 48-96 hours after online publication and is updated daily on week days.
Initial download of the metrics may take a while.